White/Caucasian vs Immigrants from Denmark 11th Grade
COMPARE
White/Caucasian
Immigrants from Denmark
11th Grade
11th Grade Comparison
Whites/Caucasians
Immigrants from Denmark
93.3%
11TH GRADE
97.4/ 100
METRIC RATING
117th/ 347
METRIC RANK
93.7%
11TH GRADE
99.5/ 100
METRIC RATING
79th/ 347
METRIC RANK
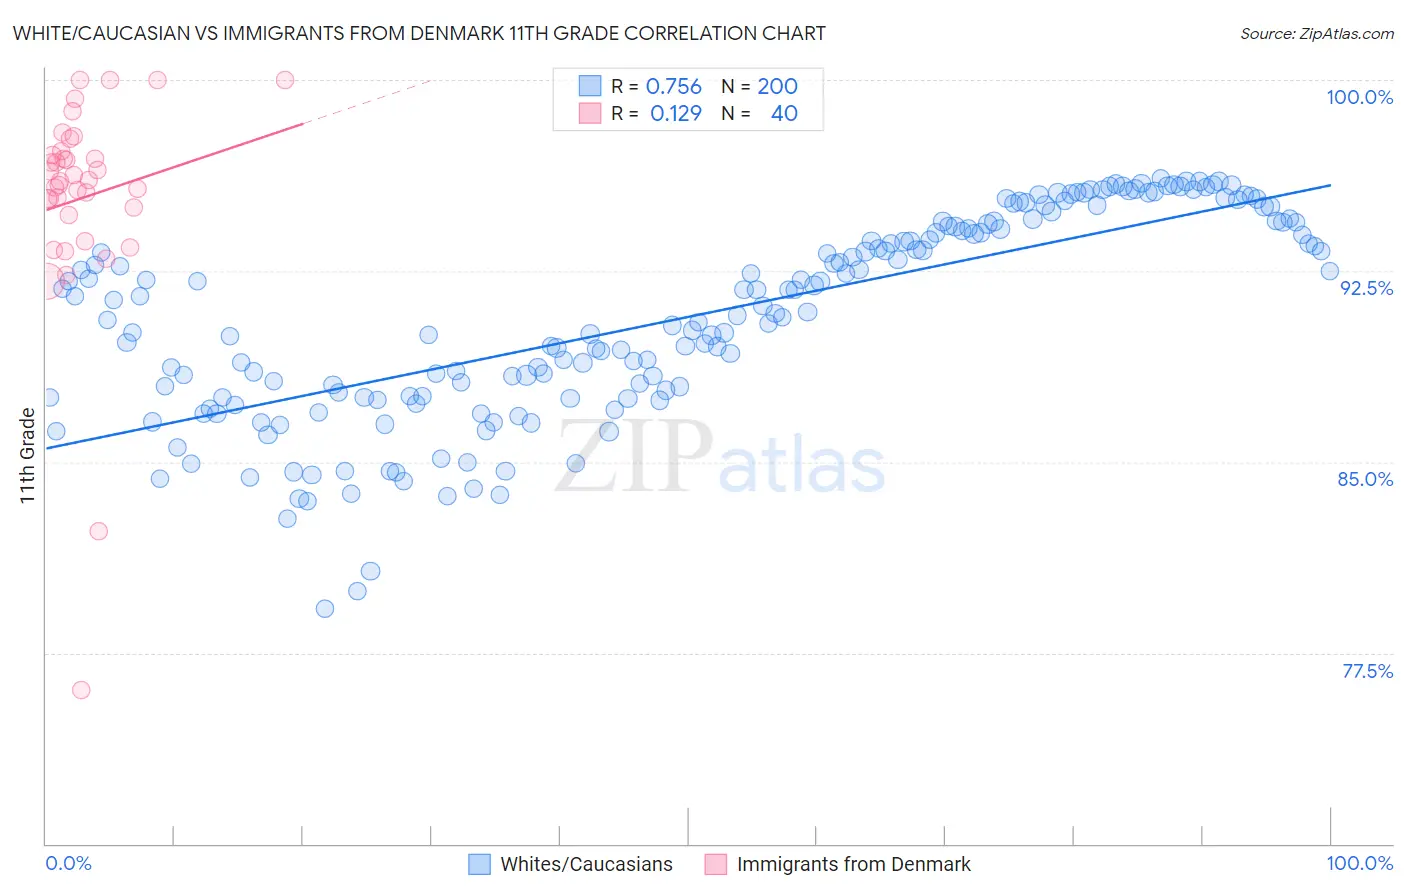
White/Caucasian vs Immigrants from Denmark 11th Grade Correlation Chart
The statistical analysis conducted on geographies consisting of 585,244,244 people shows a strong positive correlation between the proportion of Whites/Caucasians and percentage of population with at least 11th grade education in the United States with a correlation coefficient (R) of 0.756 and weighted average of 93.3%. Similarly, the statistical analysis conducted on geographies consisting of 136,430,715 people shows a poor positive correlation between the proportion of Immigrants from Denmark and percentage of population with at least 11th grade education in the United States with a correlation coefficient (R) of 0.129 and weighted average of 93.7%, a difference of 0.42%.
11th Grade Correlation Summary
| Measurement | White/Caucasian | Immigrants from Denmark |
| Minimum | 79.2% | 76.1% |
| Maximum | 96.1% | 100.0% |
| Range | 16.9% | 23.9% |
| Mean | 90.7% | 95.4% |
| Median | 91.0% | 96.0% |
| Interquartile 25% (IQ1) | 87.6% | 94.8% |
| Interquartile 75% (IQ3) | 94.2% | 97.1% |
| Interquartile Range (IQR) | 6.7% | 2.3% |
| Standard Deviation (Sample) | 4.0% | 4.4% |
| Standard Deviation (Population) | 3.9% | 4.3% |
Similar Demographics by 11th Grade
Demographics Similar to Whites/Caucasians by 11th Grade
In terms of 11th grade, the demographic groups most similar to Whites/Caucasians are Immigrants from Hungary (93.4%, a difference of 0.010%), Palestinian (93.4%, a difference of 0.030%), Jordanian (93.4%, a difference of 0.040%), Immigrants from Korea (93.3%, a difference of 0.040%), and Israeli (93.3%, a difference of 0.040%).
| Demographics | Rating | Rank | 11th Grade |
| Syrians | 98.4 /100 | #110 | Exceptional 93.4% |
| Yugoslavians | 98.1 /100 | #111 | Exceptional 93.4% |
| Immigrants | Germany | 98.0 /100 | #112 | Exceptional 93.4% |
| Immigrants | Zimbabwe | 97.8 /100 | #113 | Exceptional 93.4% |
| Jordanians | 97.8 /100 | #114 | Exceptional 93.4% |
| Palestinians | 97.7 /100 | #115 | Exceptional 93.4% |
| Immigrants | Hungary | 97.5 /100 | #116 | Exceptional 93.4% |
| Whites/Caucasians | 97.4 /100 | #117 | Exceptional 93.3% |
| Immigrants | Korea | 97.0 /100 | #118 | Exceptional 93.3% |
| Israelis | 97.0 /100 | #119 | Exceptional 93.3% |
| Immigrants | Russia | 96.6 /100 | #120 | Exceptional 93.3% |
| German Russians | 96.4 /100 | #121 | Exceptional 93.3% |
| Immigrants | Belarus | 96.3 /100 | #122 | Exceptional 93.3% |
| Immigrants | Greece | 95.9 /100 | #123 | Exceptional 93.2% |
| Immigrants | Eastern Europe | 95.9 /100 | #124 | Exceptional 93.2% |
Demographics Similar to Immigrants from Denmark by 11th Grade
In terms of 11th grade, the demographic groups most similar to Immigrants from Denmark are Celtic (93.7%, a difference of 0.010%), Aleut (93.7%, a difference of 0.010%), Soviet Union (93.7%, a difference of 0.010%), Canadian (93.7%, a difference of 0.020%), and Immigrants from Moldova (93.7%, a difference of 0.020%).
| Demographics | Rating | Rank | 11th Grade |
| Immigrants | Japan | 99.7 /100 | #72 | Exceptional 93.8% |
| Romanians | 99.6 /100 | #73 | Exceptional 93.8% |
| Immigrants | Czechoslovakia | 99.6 /100 | #74 | Exceptional 93.8% |
| Immigrants | Latvia | 99.6 /100 | #75 | Exceptional 93.8% |
| Celtics | 99.5 /100 | #76 | Exceptional 93.7% |
| Aleuts | 99.5 /100 | #77 | Exceptional 93.7% |
| Soviet Union | 99.5 /100 | #78 | Exceptional 93.7% |
| Immigrants | Denmark | 99.5 /100 | #79 | Exceptional 93.7% |
| Canadians | 99.5 /100 | #80 | Exceptional 93.7% |
| Immigrants | Moldova | 99.5 /100 | #81 | Exceptional 93.7% |
| Immigrants | Saudi Arabia | 99.3 /100 | #82 | Exceptional 93.7% |
| Icelanders | 99.3 /100 | #83 | Exceptional 93.6% |
| Immigrants | Taiwan | 99.3 /100 | #84 | Exceptional 93.6% |
| Immigrants | Switzerland | 99.3 /100 | #85 | Exceptional 93.6% |
| Immigrants | South Central Asia | 99.2 /100 | #86 | Exceptional 93.6% |