White/Caucasian vs Immigrants from West Indies Householder Income Ages 45 - 64 years
COMPARE
White/Caucasian
Immigrants from West Indies
Householder Income Ages 45 - 64 years
Householder Income Ages 45 - 64 years Comparison
Whites/Caucasians
Immigrants from West Indies
$98,091
HOUSEHOLDER INCOME AGES 45 - 64 YEARS
24.6/ 100
METRIC RATING
199th/ 347
METRIC RANK
$88,164
HOUSEHOLDER INCOME AGES 45 - 64 YEARS
0.2/ 100
METRIC RATING
266th/ 347
METRIC RANK
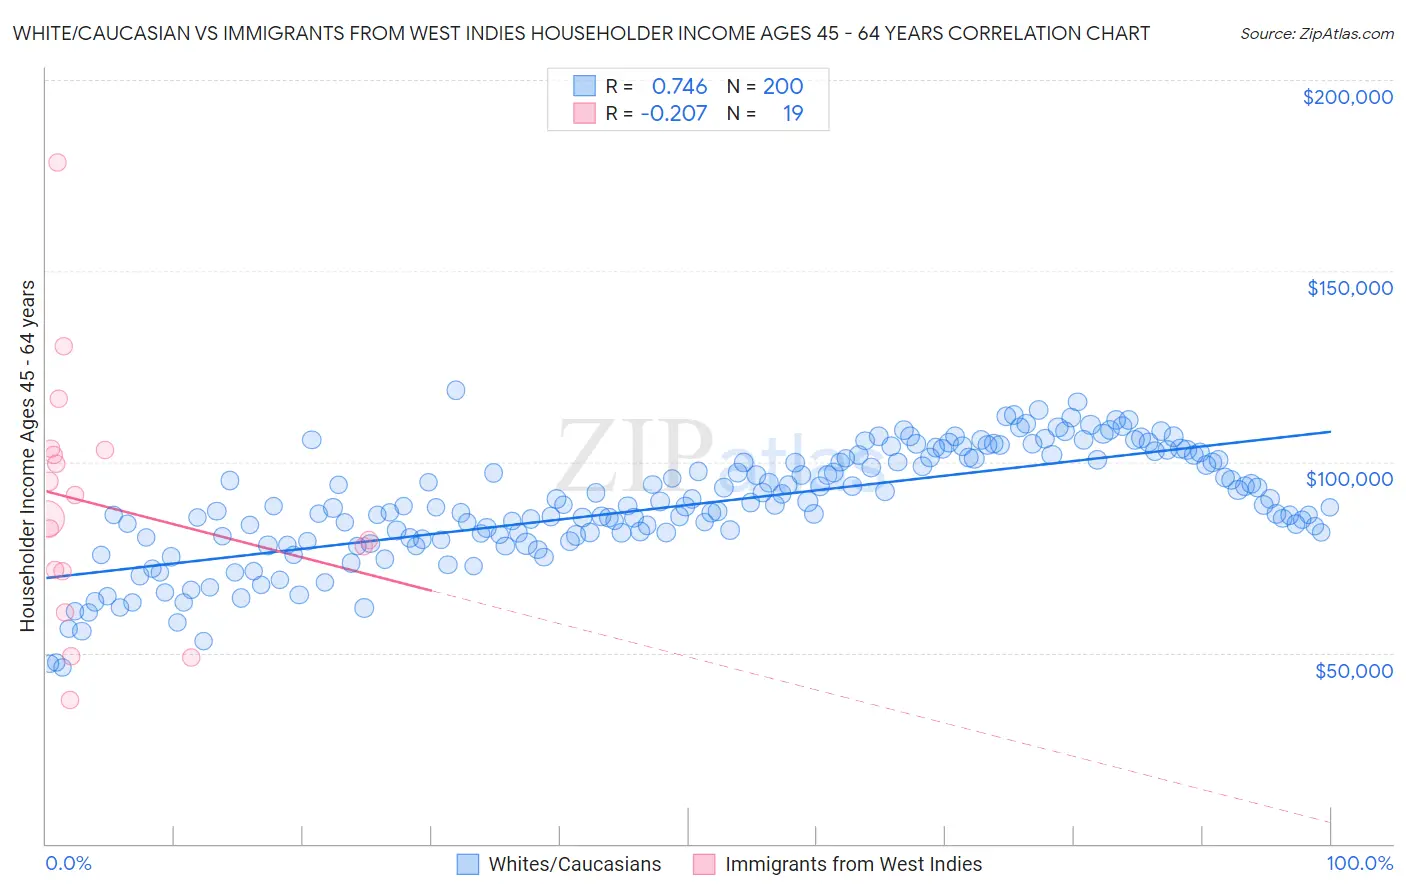
White/Caucasian vs Immigrants from West Indies Householder Income Ages 45 - 64 years Correlation Chart
The statistical analysis conducted on geographies consisting of 579,240,232 people shows a strong positive correlation between the proportion of Whites/Caucasians and household income with householder between the ages 45 and 64 in the United States with a correlation coefficient (R) of 0.746 and weighted average of $98,091. Similarly, the statistical analysis conducted on geographies consisting of 72,426,675 people shows a weak negative correlation between the proportion of Immigrants from West Indies and household income with householder between the ages 45 and 64 in the United States with a correlation coefficient (R) of -0.207 and weighted average of $88,164, a difference of 11.3%.
Householder Income Ages 45 - 64 years Correlation Summary
| Measurement | White/Caucasian | Immigrants from West Indies |
| Minimum | $46,068 | $37,750 |
| Maximum | $118,717 | $178,534 |
| Range | $72,649 | $140,784 |
| Mean | $88,743 | $88,607 |
| Median | $88,408 | $84,978 |
| Interquartile 25% (IQ1) | $80,288 | $71,324 |
| Interquartile 75% (IQ3) | $101,075 | $103,214 |
| Interquartile Range (IQR) | $20,787 | $31,890 |
| Standard Deviation (Sample) | $14,868 | $32,229 |
| Standard Deviation (Population) | $14,830 | $31,370 |
Similar Demographics by Householder Income Ages 45 - 64 years
Demographics Similar to Whites/Caucasians by Householder Income Ages 45 - 64 years
In terms of householder income ages 45 - 64 years, the demographic groups most similar to Whites/Caucasians are Immigrants from Iraq ($98,201, a difference of 0.11%), Immigrants from Kenya ($97,964, a difference of 0.13%), Puget Sound Salish ($98,340, a difference of 0.25%), Immigrants from Eastern Africa ($98,467, a difference of 0.38%), and Spanish ($98,554, a difference of 0.47%).
| Demographics | Rating | Rank | Householder Income Ages 45 - 64 years |
| Celtics | 32.9 /100 | #192 | Fair $98,896 |
| Hawaiians | 31.6 /100 | #193 | Fair $98,778 |
| Uruguayans | 30.3 /100 | #194 | Fair $98,660 |
| Spanish | 29.2 /100 | #195 | Fair $98,554 |
| Immigrants | Eastern Africa | 28.3 /100 | #196 | Fair $98,467 |
| Puget Sound Salish | 27.0 /100 | #197 | Fair $98,340 |
| Immigrants | Iraq | 25.7 /100 | #198 | Fair $98,201 |
| Whites/Caucasians | 24.6 /100 | #199 | Fair $98,091 |
| Immigrants | Kenya | 23.5 /100 | #200 | Fair $97,964 |
| Yugoslavians | 20.0 /100 | #201 | Fair $97,558 |
| Tlingit-Haida | 18.9 /100 | #202 | Poor $97,417 |
| Immigrants | Thailand | 18.8 /100 | #203 | Poor $97,400 |
| Immigrants | Eritrea | 18.6 /100 | #204 | Poor $97,373 |
| Immigrants | Colombia | 18.0 /100 | #205 | Poor $97,290 |
| Immigrants | Africa | 17.9 /100 | #206 | Poor $97,284 |
Demographics Similar to Immigrants from West Indies by Householder Income Ages 45 - 64 years
In terms of householder income ages 45 - 64 years, the demographic groups most similar to Immigrants from West Indies are Hmong ($88,115, a difference of 0.050%), Jamaican ($88,327, a difference of 0.19%), Osage ($88,390, a difference of 0.26%), Immigrants from Senegal ($88,421, a difference of 0.29%), and Immigrants from Micronesia ($87,864, a difference of 0.34%).
| Demographics | Rating | Rank | Householder Income Ages 45 - 64 years |
| Immigrants | Nicaragua | 0.4 /100 | #259 | Tragic $89,108 |
| Liberians | 0.3 /100 | #260 | Tragic $88,929 |
| Belizeans | 0.3 /100 | #261 | Tragic $88,684 |
| Somalis | 0.3 /100 | #262 | Tragic $88,600 |
| Immigrants | Senegal | 0.3 /100 | #263 | Tragic $88,421 |
| Osage | 0.3 /100 | #264 | Tragic $88,390 |
| Jamaicans | 0.2 /100 | #265 | Tragic $88,327 |
| Immigrants | West Indies | 0.2 /100 | #266 | Tragic $88,164 |
| Hmong | 0.2 /100 | #267 | Tragic $88,115 |
| Immigrants | Micronesia | 0.2 /100 | #268 | Tragic $87,864 |
| Spanish Americans | 0.2 /100 | #269 | Tragic $87,836 |
| Immigrants | Liberia | 0.2 /100 | #270 | Tragic $87,739 |
| Guatemalans | 0.2 /100 | #271 | Tragic $87,705 |
| Cape Verdeans | 0.2 /100 | #272 | Tragic $87,580 |
| Spanish American Indians | 0.2 /100 | #273 | Tragic $87,561 |