Immigrants from Oceania vs Immigrants from West Indies 11th Grade
COMPARE
Immigrants from Oceania
Immigrants from West Indies
11th Grade
11th Grade Comparison
Immigrants from Oceania
Immigrants from West Indies
92.2%
11TH GRADE
22.4/ 100
METRIC RATING
207th/ 347
METRIC RANK
90.4%
11TH GRADE
0.0/ 100
METRIC RATING
286th/ 347
METRIC RANK
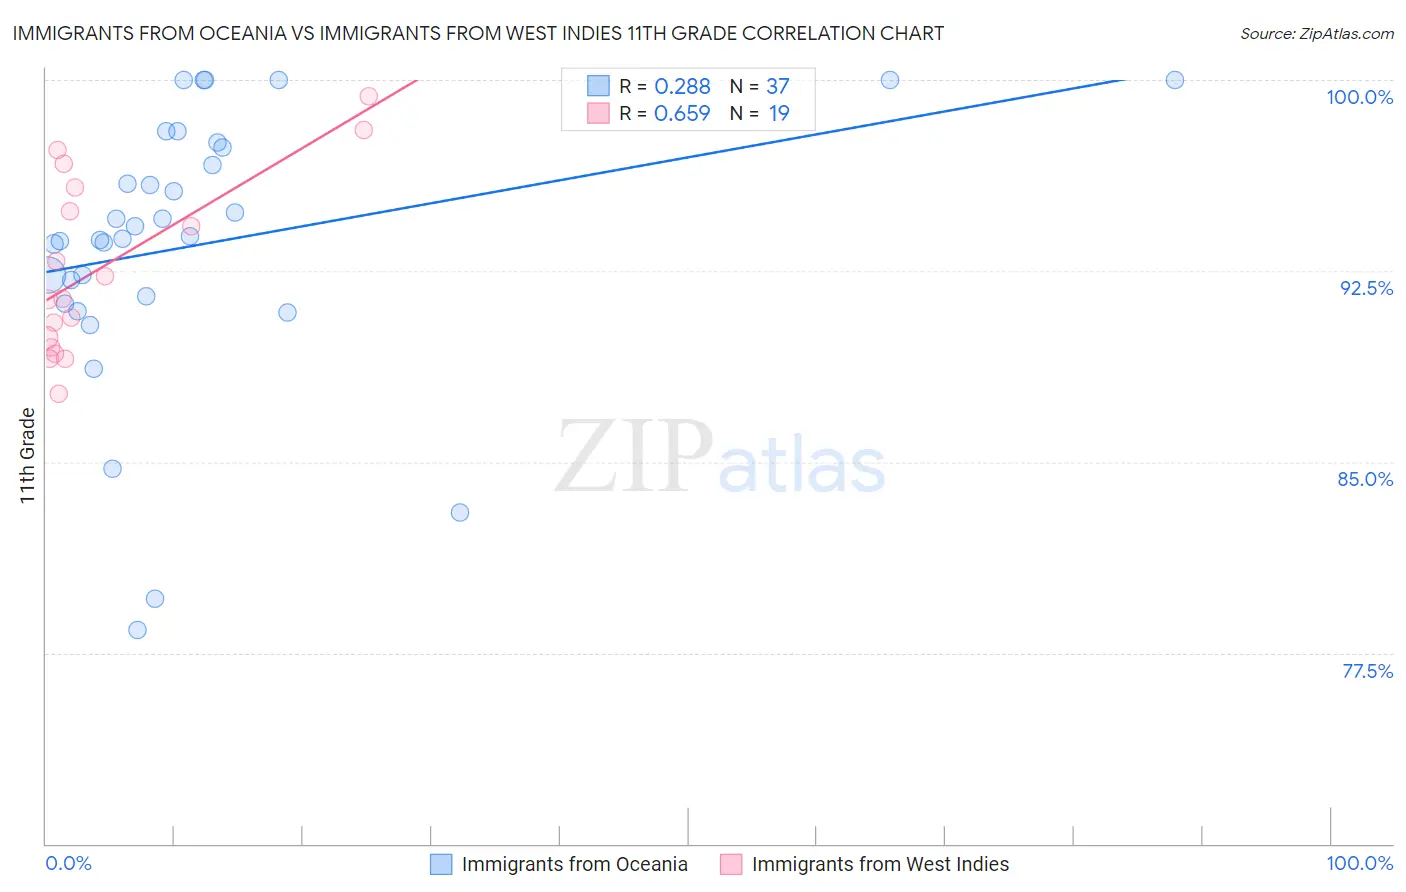
Immigrants from Oceania vs Immigrants from West Indies 11th Grade Correlation Chart
The statistical analysis conducted on geographies consisting of 305,521,521 people shows a weak positive correlation between the proportion of Immigrants from Oceania and percentage of population with at least 11th grade education in the United States with a correlation coefficient (R) of 0.288 and weighted average of 92.2%. Similarly, the statistical analysis conducted on geographies consisting of 72,457,514 people shows a significant positive correlation between the proportion of Immigrants from West Indies and percentage of population with at least 11th grade education in the United States with a correlation coefficient (R) of 0.659 and weighted average of 90.4%, a difference of 2.1%.
11th Grade Correlation Summary
| Measurement | Immigrants from Oceania | Immigrants from West Indies |
| Minimum | 78.4% | 87.7% |
| Maximum | 100.0% | 99.4% |
| Range | 21.6% | 11.7% |
| Mean | 93.6% | 92.6% |
| Median | 93.8% | 91.4% |
| Interquartile 25% (IQ1) | 91.4% | 89.5% |
| Interquartile 75% (IQ3) | 97.5% | 95.8% |
| Interquartile Range (IQR) | 6.1% | 6.3% |
| Standard Deviation (Sample) | 5.3% | 3.5% |
| Standard Deviation (Population) | 5.3% | 3.4% |
Similar Demographics by 11th Grade
Demographics Similar to Immigrants from Oceania by 11th Grade
In terms of 11th grade, the demographic groups most similar to Immigrants from Oceania are Immigrants from Sudan (92.3%, a difference of 0.010%), Immigrants from Hong Kong (92.2%, a difference of 0.010%), Kiowa (92.2%, a difference of 0.010%), Bolivian (92.2%, a difference of 0.010%), and Colville (92.2%, a difference of 0.010%).
| Demographics | Rating | Rank | 11th Grade |
| Samoans | 25.1 /100 | #200 | Fair 92.3% |
| Immigrants | China | 25.1 /100 | #201 | Fair 92.3% |
| Immigrants | Eastern Africa | 24.1 /100 | #202 | Fair 92.3% |
| Immigrants | Sudan | 23.5 /100 | #203 | Fair 92.3% |
| Immigrants | Hong Kong | 23.3 /100 | #204 | Fair 92.2% |
| Kiowa | 23.2 /100 | #205 | Fair 92.2% |
| Bolivians | 23.2 /100 | #206 | Fair 92.2% |
| Immigrants | Oceania | 22.4 /100 | #207 | Fair 92.2% |
| Colville | 21.8 /100 | #208 | Fair 92.2% |
| Tongans | 19.8 /100 | #209 | Poor 92.2% |
| Ethiopians | 18.8 /100 | #210 | Poor 92.2% |
| Immigrants | Micronesia | 17.7 /100 | #211 | Poor 92.2% |
| Koreans | 14.4 /100 | #212 | Poor 92.1% |
| Immigrants | Ethiopia | 13.9 /100 | #213 | Poor 92.1% |
| Afghans | 12.8 /100 | #214 | Poor 92.1% |
Demographics Similar to Immigrants from West Indies by 11th Grade
In terms of 11th grade, the demographic groups most similar to Immigrants from West Indies are Apache (90.4%, a difference of 0.010%), Pennsylvania German (90.3%, a difference of 0.030%), Immigrants from Burma/Myanmar (90.4%, a difference of 0.050%), British West Indian (90.3%, a difference of 0.050%), and Indonesian (90.3%, a difference of 0.080%).
| Demographics | Rating | Rank | 11th Grade |
| Barbadians | 0.0 /100 | #279 | Tragic 90.8% |
| Sri Lankans | 0.0 /100 | #280 | Tragic 90.7% |
| Dutch West Indians | 0.0 /100 | #281 | Tragic 90.7% |
| Immigrants | St. Vincent and the Grenadines | 0.0 /100 | #282 | Tragic 90.7% |
| Immigrants | Barbados | 0.0 /100 | #283 | Tragic 90.7% |
| Immigrants | Laos | 0.0 /100 | #284 | Tragic 90.5% |
| Immigrants | Burma/Myanmar | 0.0 /100 | #285 | Tragic 90.4% |
| Immigrants | West Indies | 0.0 /100 | #286 | Tragic 90.4% |
| Apache | 0.0 /100 | #287 | Tragic 90.4% |
| Pennsylvania Germans | 0.0 /100 | #288 | Tragic 90.3% |
| British West Indians | 0.0 /100 | #289 | Tragic 90.3% |
| Indonesians | 0.0 /100 | #290 | Tragic 90.3% |
| Haitians | 0.0 /100 | #291 | Tragic 90.3% |
| Cubans | 0.0 /100 | #292 | Tragic 90.2% |
| Natives/Alaskans | 0.0 /100 | #293 | Tragic 90.2% |