Romanian vs Immigrants from West Indies 11th Grade

COMPARE

Romanian
Race
Ancestry
AfghanAfricanAlaska NativeAlaskan AthabascanAlbanianAleutAlsatianAmericanApacheArabArapahoArgentineanArmenianAssyrian/Chaldean/SyriacAustralianAustrianBahamianBangladeshiBarbadianBasqueBelgianBelizeanBermudanBhutaneseBlackfeetBolivianBrazilianBritishBritish West IndianBulgarianBurmeseCajunCambodianCanadianCape VerdeanCarpatho RusynCelticCentral AmericanCentral American IndianCherokeeCheyenneChickasawChileanChineseChippewaChoctawColombianColvilleComancheCosta RicanCreeCreekCroatianCrowCubanCypriotCzechCzechoslovakianDanishDelawareDominicanDutchDutch West IndianEastern EuropeanEcuadorianEgyptianEnglishEstonianEthiopianEuropeanFijianFilipinoFinnishFrenchFrench American IndianFrench CanadianGermanGerman RussianGhanaianGreekGuamanian/ChamorroGuatemalanGuyaneseHaitianHmongHonduranHopiHoumaHungarianIcelanderIndian (Asian)IndonesianInupiatIranianIraqiIrishIroquoisIsraeliItalianJamaicanJapaneseJordanianKenyanKiowaKoreanLaotianLatvianLebaneseLiberianLithuanianLumbeeLuxembourgerMacedonianMalaysianMalteseMarshalleseMenomineeMexicanMexican American IndianMongolianMoroccanNative HawaiianNavajoNepaleseNew ZealanderNicaraguanNigerianNorthern EuropeanNorwegianOkinawanOsageOttawaPaiutePakistaniPalestinianPanamanianParaguayanPennsylvania GermanPeruvianPimaPolishPortuguesePotawatomiPuebloPuerto RicanPuget Sound SalishRomanianRussianSalvadoranSamoanScandinavianScotch-IrishScottishSeminoleSenegaleseSerbianShoshoneSierra LeoneanSiouxSlavicSlovakSloveneSomaliSouth AfricanSouth AmericanSouth American IndianSoviet UnionSpaniardSpanishSpanish AmericanSpanish American IndianSri LankanSubsaharan AfricanSudaneseSwedishSwissSyrianTaiwaneseThaiTlingit-HaidaTohono O'OdhamTonganTrinidadian and TobagonianTsimshianTurkishU.S. Virgin IslanderUgandanUkrainianUruguayanUteVenezuelanVietnameseWelshWest IndianYakamaYaquiYugoslavianYumanYup'ikZimbabwean
Immigration
NonimmigrantsImmigrantsAfghanistanAfricaAlbaniaArgentinaArmeniaAsiaAustraliaAustriaBahamasBangladeshBarbadosBelarusBelgiumBelizeBoliviaBosnia and HerzegovinaBrazilBulgariaBurma/MyanmarCabo VerdeCambodiaCameroonCanadaCaribbeanCentral AmericaChileChinaColombiaCongoCosta RicaCroatiaCubaCzechoslovakiaDenmarkDominicaDominican RepublicEastern AfricaEastern AsiaEastern EuropeEcuadorEgyptEl SalvadorEnglandEritreaEthiopiaEuropeFijiFranceGermanyGhanaGreeceGrenadaGuatemalaGuyanaHaitiHondurasHong KongHungaryIndiaIndonesiaIranIraqIrelandIsraelItalyJamaicaJapanJordanKazakhstanKenyaKoreaKuwaitLaosLatin AmericaLatviaLebanonLiberiaLithuaniaMalaysiaMexicoMicronesiaMiddle AfricaMoldovaMoroccoNepalNetherlandsNicaraguaNigeriaNorth AmericaNorth MacedoniaNorthern AfricaNorthern EuropeNorwayOceaniaPakistanPanamaPeruPhilippinesPolandPortugalRomaniaRussiaSaudi ArabiaScotlandSenegalSerbiaSierra LeoneSingaporeSomaliaSouth AfricaSouth AmericaSouth Central AsiaSouth Eastern AsiaSouthern EuropeSpainSri LankaSt. Vincent and the GrenadinesSudanSwedenSwitzerlandSyriaTaiwanThailandTrinidad and TobagoTurkeyUgandaUkraineUruguayUzbekistanVenezuelaVietnamWestern AfricaWestern AsiaWestern EuropeYemenZaireZimbabweAzores
Immigrants from West Indies
Race
Ancestry
AfghanAfricanAlaska NativeAlaskan AthabascanAlbanianAleutAlsatianAmericanApacheArabArapahoArgentineanArmenianAssyrian/Chaldean/SyriacAustralianAustrianBahamianBangladeshiBarbadianBasqueBelgianBelizeanBermudanBhutaneseBlackfeetBolivianBrazilianBritishBritish West IndianBulgarianBurmeseCajunCambodianCanadianCape VerdeanCarpatho RusynCelticCentral AmericanCentral American IndianCherokeeCheyenneChickasawChileanChineseChippewaChoctawColombianColvilleComancheCosta RicanCreeCreekCroatianCrowCubanCypriotCzechCzechoslovakianDanishDelawareDominicanDutchDutch West IndianEastern EuropeanEcuadorianEgyptianEnglishEstonianEthiopianEuropeanFijianFilipinoFinnishFrenchFrench American IndianFrench CanadianGermanGerman RussianGhanaianGreekGuamanian/ChamorroGuatemalanGuyaneseHaitianHmongHonduranHopiHoumaHungarianIcelanderIndian (Asian)IndonesianInupiatIranianIraqiIrishIroquoisIsraeliItalianJamaicanJapaneseJordanianKenyanKiowaKoreanLaotianLatvianLebaneseLiberianLithuanianLumbeeLuxembourgerMacedonianMalaysianMalteseMarshalleseMenomineeMexicanMexican American IndianMongolianMoroccanNative HawaiianNavajoNepaleseNew ZealanderNicaraguanNigerianNorthern EuropeanNorwegianOkinawanOsageOttawaPaiutePakistaniPalestinianPanamanianParaguayanPennsylvania GermanPeruvianPimaPolishPortuguesePotawatomiPuebloPuerto RicanPuget Sound SalishRussianSalvadoranSamoanScandinavianScotch-IrishScottishSeminoleSenegaleseSerbianShoshoneSierra LeoneanSiouxSlavicSlovakSloveneSomaliSouth AfricanSouth AmericanSouth American IndianSoviet UnionSpaniardSpanishSpanish AmericanSpanish American IndianSri LankanSubsaharan AfricanSudaneseSwedishSwissSyrianTaiwaneseThaiTlingit-HaidaTohono O'OdhamTonganTrinidadian and TobagonianTsimshianTurkishU.S. Virgin IslanderUgandanUkrainianUruguayanUteVenezuelanVietnameseWelshWest IndianYakamaYaquiYugoslavianYumanYup'ikZimbabwean
Immigration
NonimmigrantsImmigrantsAfghanistanAfricaAlbaniaArgentinaArmeniaAsiaAustraliaAustriaBahamasBangladeshBarbadosBelarusBelgiumBelizeBoliviaBosnia and HerzegovinaBrazilBulgariaBurma/MyanmarCabo VerdeCambodiaCameroonCanadaCaribbeanCentral AmericaChileChinaColombiaCongoCosta RicaCroatiaCubaCzechoslovakiaDenmarkDominicaDominican RepublicEastern AfricaEastern AsiaEastern EuropeEcuadorEgyptEl SalvadorEnglandEritreaEthiopiaEuropeFijiFranceGermanyGhanaGreeceGrenadaGuatemalaGuyanaHaitiHondurasHong KongHungaryIndiaIndonesiaIranIraqIrelandIsraelItalyJamaicaJapanJordanKazakhstanKenyaKoreaKuwaitLaosLatin AmericaLatviaLebanonLiberiaLithuaniaMalaysiaMexicoMicronesiaMiddle AfricaMoldovaMoroccoNepalNetherlandsNicaraguaNigeriaNorth AmericaNorth MacedoniaNorthern AfricaNorthern EuropeNorwayOceaniaPakistanPanamaPeruPhilippinesPolandPortugalRomaniaRussiaSaudi ArabiaScotlandSenegalSerbiaSierra LeoneSingaporeSomaliaSouth AfricaSouth AmericaSouth Central AsiaSouth Eastern AsiaSouthern EuropeSpainSri LankaSt. Vincent and the GrenadinesSudanSwedenSwitzerlandSyriaTaiwanThailandTrinidad and TobagoTurkeyUgandaUkraineUruguayUzbekistanVenezuelaVietnamWest IndiesWestern AfricaWestern AsiaWestern EuropeYemenZaireZimbabweAzores
11th Grade
Income
Poverty
Unemployment
Labor Participation
Family Structure
Vehicle Availability
Education Level
Disability

11th Grade Comparison

Romanians

Immigrants from West Indies

Exceptional
Tragic
93.8%
11TH GRADE
99.6/ 100
METRIC RATING
73rd/ 347
METRIC RANK
90.4%
11TH GRADE
0.0/ 100
METRIC RATING
286th/ 347
METRIC RANK

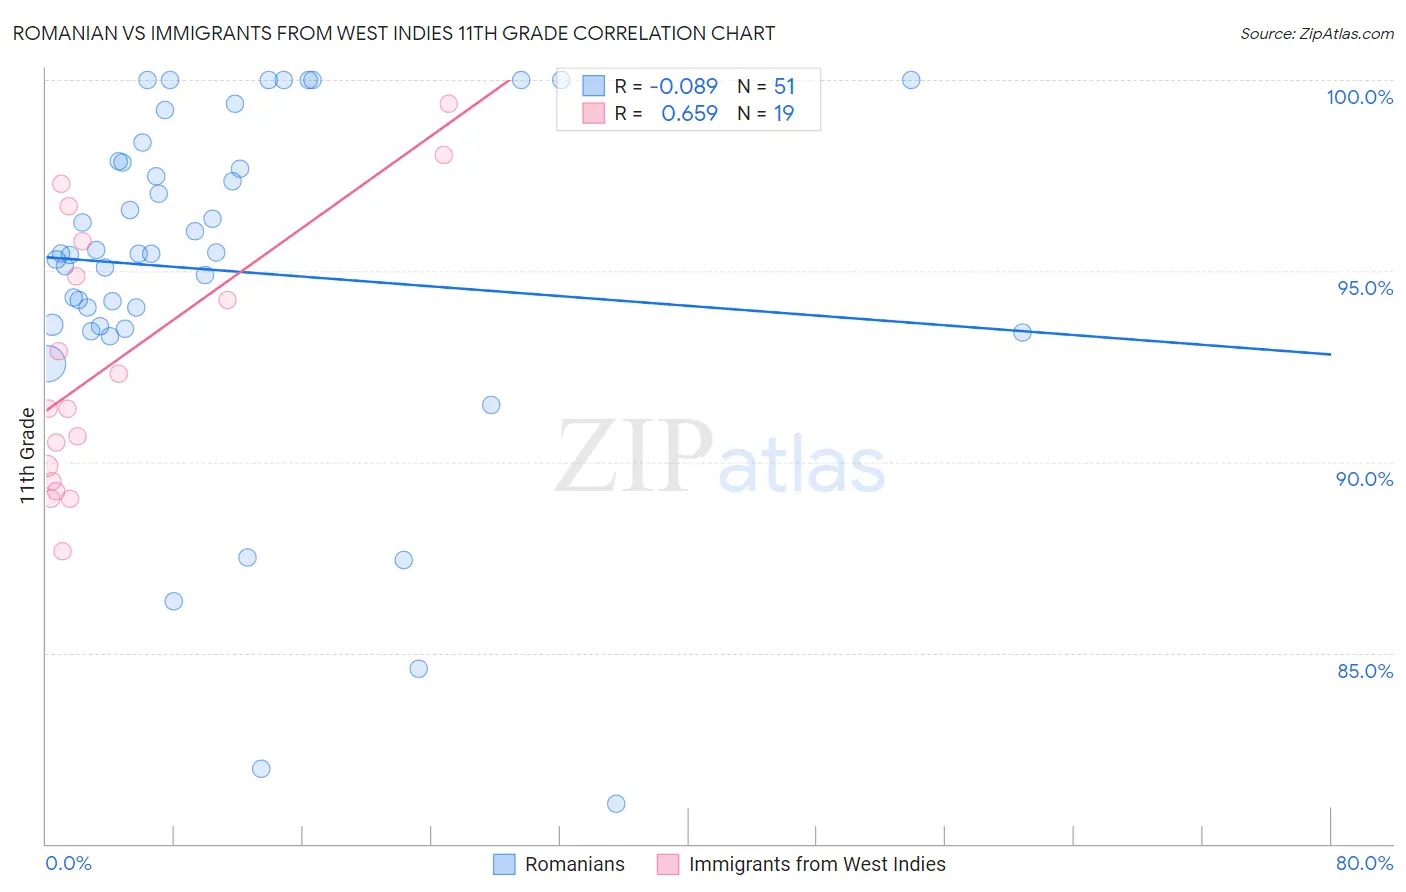
Romanian vs Immigrants from West Indies 11th Grade Correlation Chart

The statistical analysis conducted on geographies consisting of 377,905,400 people shows a slight negative correlation between the proportion of Romanians and percentage of population with at least 11th grade education in the United States with a correlation coefficient (R) of -0.089 and weighted average of 93.8%. Similarly, the statistical analysis conducted on geographies consisting of 72,457,514 people shows a significant positive correlation between the proportion of Immigrants from West Indies and percentage of population with at least 11th grade education in the United States with a correlation coefficient (R) of 0.659 and weighted average of 90.4%, a difference of 3.8%.
Romanian vs Immigrants from West Indies 11th Grade

11th Grade Correlation Summary

MeasurementRomanianImmigrants from West Indies
Minimum81.0%87.7%
Maximum100.0%99.4%
Range19.0%11.7%
Mean95.0%92.6%
Median95.5%91.4%
Interquartile 25% (IQ1)93.5%89.5%
Interquartile 75% (IQ3)97.9%95.8%
Interquartile Range (IQR)4.3%6.3%
Standard Deviation (Sample)4.5%3.5%
Standard Deviation (Population)4.5%3.4%

Similar Demographics by 11th Grade

Demographics Similar to Romanians by 11th Grade

In terms of 11th grade, the demographic groups most similar to Romanians are Immigrants from Czechoslovakia (93.8%, a difference of 0.0%), Immigrants from Japan (93.8%, a difference of 0.020%), Immigrants from Latvia (93.8%, a difference of 0.020%), Immigrants from South Africa (93.8%, a difference of 0.050%), and Celtic (93.7%, a difference of 0.050%).
DemographicsRating | Rank11th Grade
Alaskan Athabascans
99.8
/100
|
#66
Exceptional
93.9%
Immigrants | Netherlands
99.8
/100
|
#67
Exceptional
93.9%
Zimbabweans
99.8
/100
|
#68
Exceptional
93.9%
Scotch-Irish
99.8
/100
|
#69
Exceptional
93.9%
Immigrants | England
99.7
/100
|
#70
Exceptional
93.8%
Immigrants | South Africa
99.7
/100
|
#71
Exceptional
93.8%
Immigrants | Japan
99.7
/100
|
#72
Exceptional
93.8%
Romanians
99.6
/100
|
#73
Exceptional
93.8%
Immigrants | Czechoslovakia
99.6
/100
|
#74
Exceptional
93.8%
Immigrants | Latvia
99.6
/100
|
#75
Exceptional
93.8%
Celtics
99.5
/100
|
#76
Exceptional
93.7%
Aleuts
99.5
/100
|
#77
Exceptional
93.7%
Soviet Union
99.5
/100
|
#78
Exceptional
93.7%
Immigrants | Denmark
99.5
/100
|
#79
Exceptional
93.7%
Canadians
99.5
/100
|
#80
Exceptional
93.7%

Demographics Similar to Immigrants from West Indies by 11th Grade

In terms of 11th grade, the demographic groups most similar to Immigrants from West Indies are Apache (90.4%, a difference of 0.010%), Pennsylvania German (90.3%, a difference of 0.030%), Immigrants from Burma/Myanmar (90.4%, a difference of 0.050%), British West Indian (90.3%, a difference of 0.050%), and Indonesian (90.3%, a difference of 0.080%).
DemographicsRating | Rank11th Grade
Barbadians
0.0
/100
|
#279
Tragic
90.8%
Sri Lankans
0.0
/100
|
#280
Tragic
90.7%
Dutch West Indians
0.0
/100
|
#281
Tragic
90.7%
Immigrants | St. Vincent and the Grenadines
0.0
/100
|
#282
Tragic
90.7%
Immigrants | Barbados
0.0
/100
|
#283
Tragic
90.7%
Immigrants | Laos
0.0
/100
|
#284
Tragic
90.5%
Immigrants | Burma/Myanmar
0.0
/100
|
#285
Tragic
90.4%
Immigrants | West Indies
0.0
/100
|
#286
Tragic
90.4%
Apache
0.0
/100
|
#287
Tragic
90.4%
Pennsylvania Germans
0.0
/100
|
#288
Tragic
90.3%
British West Indians
0.0
/100
|
#289
Tragic
90.3%
Indonesians
0.0
/100
|
#290
Tragic
90.3%
Haitians
0.0
/100
|
#291
Tragic
90.3%
Cubans
0.0
/100
|
#292
Tragic
90.2%
Natives/Alaskans
0.0
/100
|
#293
Tragic
90.2%