Immigrants from Malaysia vs European Bachelor's Degree
COMPARE
Immigrants from Malaysia
European
Bachelor's Degree
Bachelor's Degree Comparison
Immigrants from Malaysia
Europeans
45.0%
BACHELOR'S DEGREE
100.0/ 100
METRIC RATING
41st/ 347
METRIC RANK
39.5%
BACHELOR'S DEGREE
85.6/ 100
METRIC RATING
138th/ 347
METRIC RANK
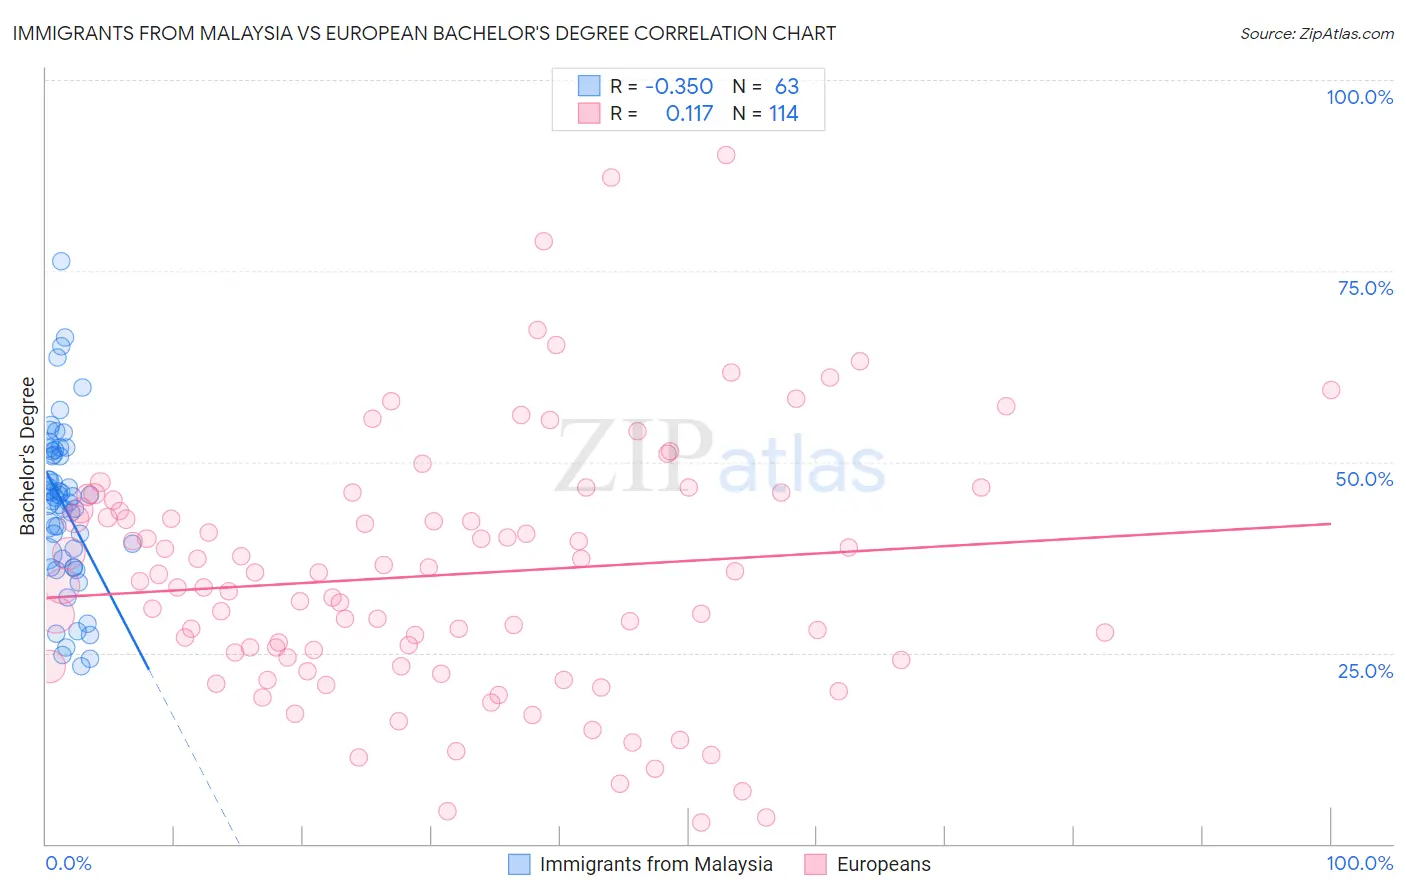
Immigrants from Malaysia vs European Bachelor's Degree Correlation Chart
The statistical analysis conducted on geographies consisting of 197,964,670 people shows a mild negative correlation between the proportion of Immigrants from Malaysia and percentage of population with at least bachelor's degree education in the United States with a correlation coefficient (R) of -0.350 and weighted average of 45.0%. Similarly, the statistical analysis conducted on geographies consisting of 561,699,740 people shows a poor positive correlation between the proportion of Europeans and percentage of population with at least bachelor's degree education in the United States with a correlation coefficient (R) of 0.117 and weighted average of 39.5%, a difference of 14.1%.
Bachelor's Degree Correlation Summary
| Measurement | Immigrants from Malaysia | European |
| Minimum | 23.2% | 2.8% |
| Maximum | 76.2% | 90.2% |
| Range | 53.0% | 87.4% |
| Mean | 44.4% | 35.2% |
| Median | 45.3% | 34.1% |
| Interquartile 25% (IQ1) | 37.4% | 24.1% |
| Interquartile 75% (IQ3) | 51.4% | 43.7% |
| Interquartile Range (IQR) | 14.1% | 19.5% |
| Standard Deviation (Sample) | 10.7% | 16.6% |
| Standard Deviation (Population) | 10.6% | 16.6% |
Similar Demographics by Bachelor's Degree
Demographics Similar to Immigrants from Malaysia by Bachelor's Degree
In terms of bachelor's degree, the demographic groups most similar to Immigrants from Malaysia are Immigrants from Belarus (45.0%, a difference of 0.040%), Immigrants from Latvia (45.1%, a difference of 0.31%), Immigrants from Saudi Arabia (44.8%, a difference of 0.38%), Immigrants from South Africa (44.8%, a difference of 0.52%), and Bulgarian (45.3%, a difference of 0.64%).
| Demographics | Rating | Rank | Bachelor's Degree |
| Immigrants | Denmark | 100.0 /100 | #34 | Exceptional 45.4% |
| Immigrants | Russia | 100.0 /100 | #35 | Exceptional 45.4% |
| Mongolians | 100.0 /100 | #36 | Exceptional 45.4% |
| Russians | 100.0 /100 | #37 | Exceptional 45.3% |
| Bulgarians | 100.0 /100 | #38 | Exceptional 45.3% |
| Immigrants | Latvia | 100.0 /100 | #39 | Exceptional 45.1% |
| Immigrants | Belarus | 100.0 /100 | #40 | Exceptional 45.0% |
| Immigrants | Malaysia | 100.0 /100 | #41 | Exceptional 45.0% |
| Immigrants | Saudi Arabia | 100.0 /100 | #42 | Exceptional 44.8% |
| Immigrants | South Africa | 99.9 /100 | #43 | Exceptional 44.8% |
| Immigrants | Lithuania | 99.9 /100 | #44 | Exceptional 44.6% |
| Immigrants | Kuwait | 99.9 /100 | #45 | Exceptional 44.6% |
| Immigrants | Bulgaria | 99.9 /100 | #46 | Exceptional 44.6% |
| Bolivians | 99.9 /100 | #47 | Exceptional 44.6% |
| Estonians | 99.9 /100 | #48 | Exceptional 44.6% |
Demographics Similar to Europeans by Bachelor's Degree
In terms of bachelor's degree, the demographic groups most similar to Europeans are Icelander (39.5%, a difference of 0.17%), Immigrants from Sudan (39.4%, a difference of 0.20%), Immigrants from Armenia (39.4%, a difference of 0.27%), South American Indian (39.3%, a difference of 0.35%), and Pakistani (39.7%, a difference of 0.54%).
| Demographics | Rating | Rank | Bachelor's Degree |
| Italians | 91.9 /100 | #131 | Exceptional 40.1% |
| Taiwanese | 91.1 /100 | #132 | Exceptional 40.0% |
| Immigrants | Southern Europe | 91.1 /100 | #133 | Exceptional 40.0% |
| Assyrians/Chaldeans/Syriacs | 89.4 /100 | #134 | Excellent 39.8% |
| Luxembourgers | 89.1 /100 | #135 | Excellent 39.8% |
| Pakistanis | 88.2 /100 | #136 | Excellent 39.7% |
| Icelanders | 86.5 /100 | #137 | Excellent 39.5% |
| Europeans | 85.6 /100 | #138 | Excellent 39.5% |
| Immigrants | Sudan | 84.5 /100 | #139 | Excellent 39.4% |
| Immigrants | Armenia | 84.1 /100 | #140 | Excellent 39.4% |
| South American Indians | 83.6 /100 | #141 | Excellent 39.3% |
| Immigrants | North Macedonia | 81.6 /100 | #142 | Excellent 39.2% |
| Poles | 79.8 /100 | #143 | Good 39.1% |
| Immigrants | Afghanistan | 79.7 /100 | #144 | Good 39.1% |
| Slovenes | 79.5 /100 | #145 | Good 39.1% |