Bhutanese vs European Bachelor's Degree
COMPARE
Bhutanese
European
Bachelor's Degree
Bachelor's Degree Comparison
Bhutanese
Europeans
42.7%
BACHELOR'S DEGREE
99.5/ 100
METRIC RATING
74th/ 347
METRIC RANK
39.5%
BACHELOR'S DEGREE
85.6/ 100
METRIC RATING
138th/ 347
METRIC RANK
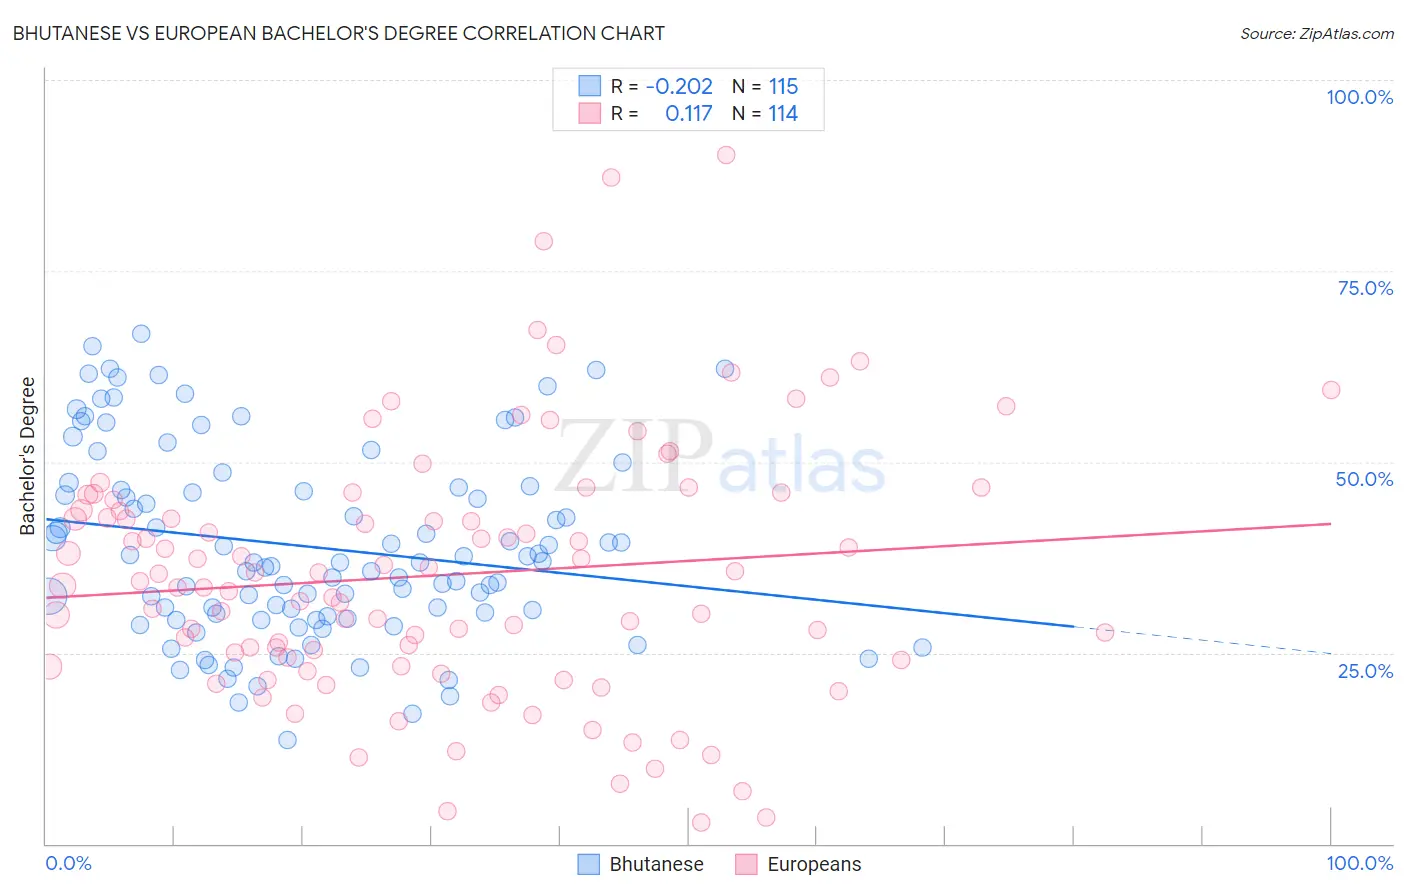
Bhutanese vs European Bachelor's Degree Correlation Chart
The statistical analysis conducted on geographies consisting of 455,522,940 people shows a weak negative correlation between the proportion of Bhutanese and percentage of population with at least bachelor's degree education in the United States with a correlation coefficient (R) of -0.202 and weighted average of 42.7%. Similarly, the statistical analysis conducted on geographies consisting of 561,699,740 people shows a poor positive correlation between the proportion of Europeans and percentage of population with at least bachelor's degree education in the United States with a correlation coefficient (R) of 0.117 and weighted average of 39.5%, a difference of 8.1%.
Bachelor's Degree Correlation Summary
| Measurement | Bhutanese | European |
| Minimum | 13.6% | 2.8% |
| Maximum | 66.7% | 90.2% |
| Range | 53.1% | 87.4% |
| Mean | 38.8% | 35.2% |
| Median | 36.9% | 34.1% |
| Interquartile 25% (IQ1) | 29.8% | 24.1% |
| Interquartile 75% (IQ3) | 46.7% | 43.7% |
| Interquartile Range (IQR) | 16.9% | 19.5% |
| Standard Deviation (Sample) | 12.4% | 16.6% |
| Standard Deviation (Population) | 12.3% | 16.6% |
Similar Demographics by Bachelor's Degree
Demographics Similar to Bhutanese by Bachelor's Degree
In terms of bachelor's degree, the demographic groups most similar to Bhutanese are Immigrants from Zimbabwe (42.6%, a difference of 0.21%), Immigrants from Uzbekistan (42.8%, a difference of 0.22%), Immigrants from Egypt (42.6%, a difference of 0.23%), Ethiopian (42.8%, a difference of 0.27%), and Immigrants from Argentina (42.8%, a difference of 0.36%).
| Demographics | Rating | Rank | Bachelor's Degree |
| Egyptians | 99.7 /100 | #67 | Exceptional 43.3% |
| Immigrants | Indonesia | 99.7 /100 | #68 | Exceptional 43.3% |
| Immigrants | Pakistan | 99.7 /100 | #69 | Exceptional 43.1% |
| Immigrants | Romania | 99.6 /100 | #70 | Exceptional 42.9% |
| Immigrants | Argentina | 99.6 /100 | #71 | Exceptional 42.8% |
| Ethiopians | 99.5 /100 | #72 | Exceptional 42.8% |
| Immigrants | Uzbekistan | 99.5 /100 | #73 | Exceptional 42.8% |
| Bhutanese | 99.5 /100 | #74 | Exceptional 42.7% |
| Immigrants | Zimbabwe | 99.4 /100 | #75 | Exceptional 42.6% |
| Immigrants | Egypt | 99.4 /100 | #76 | Exceptional 42.6% |
| Immigrants | Eastern Europe | 99.4 /100 | #77 | Exceptional 42.5% |
| Immigrants | Ethiopia | 99.4 /100 | #78 | Exceptional 42.5% |
| Immigrants | Lebanon | 99.3 /100 | #79 | Exceptional 42.4% |
| Immigrants | Croatia | 99.2 /100 | #80 | Exceptional 42.3% |
| Immigrants | Hungary | 99.2 /100 | #81 | Exceptional 42.3% |
Demographics Similar to Europeans by Bachelor's Degree
In terms of bachelor's degree, the demographic groups most similar to Europeans are Icelander (39.5%, a difference of 0.17%), Immigrants from Sudan (39.4%, a difference of 0.20%), Immigrants from Armenia (39.4%, a difference of 0.27%), South American Indian (39.3%, a difference of 0.35%), and Pakistani (39.7%, a difference of 0.54%).
| Demographics | Rating | Rank | Bachelor's Degree |
| Italians | 91.9 /100 | #131 | Exceptional 40.1% |
| Taiwanese | 91.1 /100 | #132 | Exceptional 40.0% |
| Immigrants | Southern Europe | 91.1 /100 | #133 | Exceptional 40.0% |
| Assyrians/Chaldeans/Syriacs | 89.4 /100 | #134 | Excellent 39.8% |
| Luxembourgers | 89.1 /100 | #135 | Excellent 39.8% |
| Pakistanis | 88.2 /100 | #136 | Excellent 39.7% |
| Icelanders | 86.5 /100 | #137 | Excellent 39.5% |
| Europeans | 85.6 /100 | #138 | Excellent 39.5% |
| Immigrants | Sudan | 84.5 /100 | #139 | Excellent 39.4% |
| Immigrants | Armenia | 84.1 /100 | #140 | Excellent 39.4% |
| South American Indians | 83.6 /100 | #141 | Excellent 39.3% |
| Immigrants | North Macedonia | 81.6 /100 | #142 | Excellent 39.2% |
| Poles | 79.8 /100 | #143 | Good 39.1% |
| Immigrants | Afghanistan | 79.7 /100 | #144 | Good 39.1% |
| Slovenes | 79.5 /100 | #145 | Good 39.1% |