White/Caucasian vs German Russian Bachelor's Degree
COMPARE
White/Caucasian
German Russian
Bachelor's Degree
Bachelor's Degree Comparison
Whites/Caucasians
German Russians
35.3%
BACHELOR'S DEGREE
5.9/ 100
METRIC RATING
229th/ 347
METRIC RANK
35.8%
BACHELOR'S DEGREE
10.2/ 100
METRIC RATING
217th/ 347
METRIC RANK
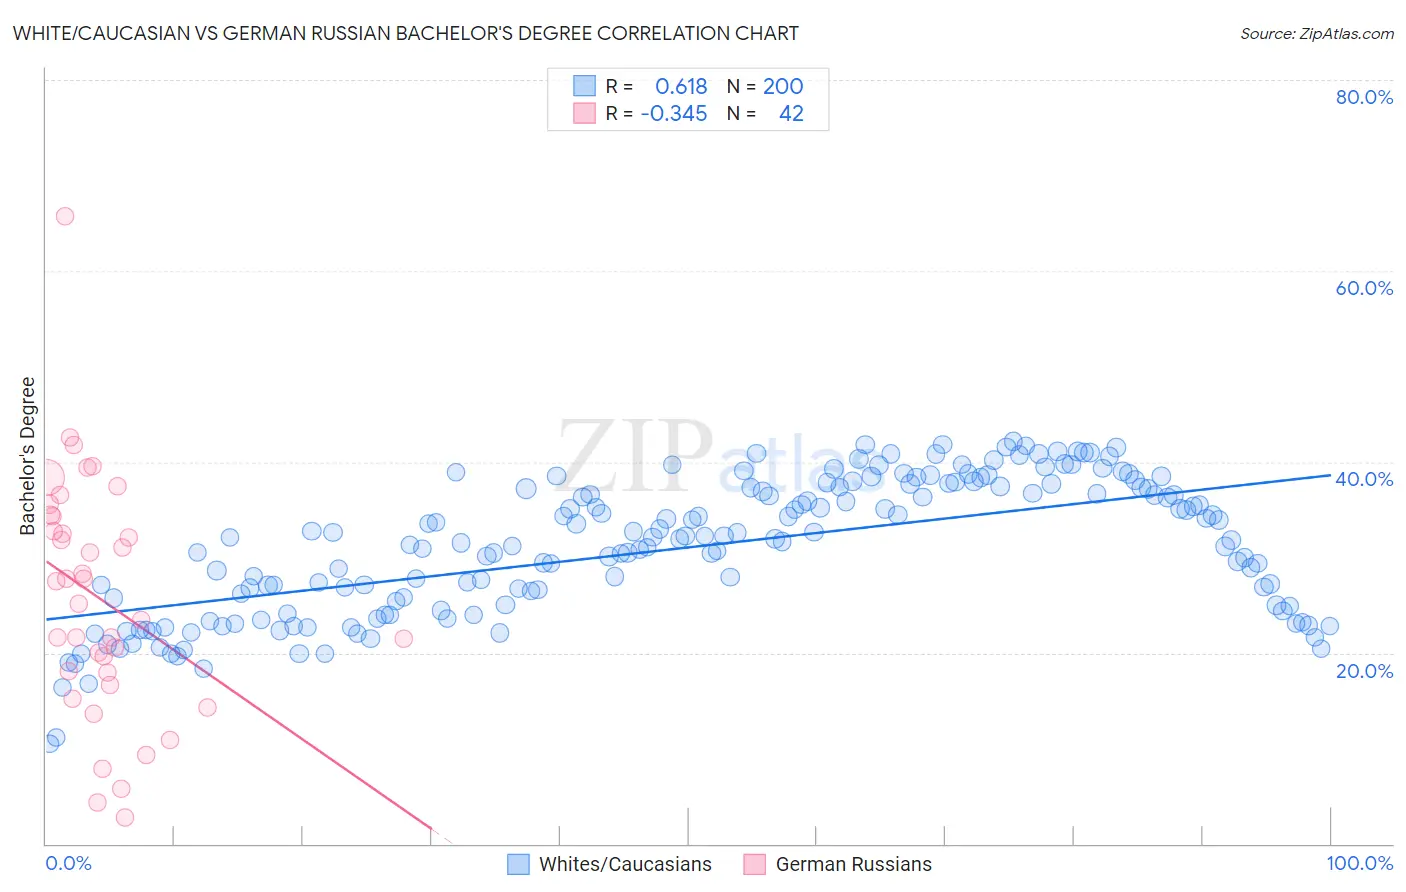
White/Caucasian vs German Russian Bachelor's Degree Correlation Chart
The statistical analysis conducted on geographies consisting of 584,716,229 people shows a significant positive correlation between the proportion of Whites/Caucasians and percentage of population with at least bachelor's degree education in the United States with a correlation coefficient (R) of 0.618 and weighted average of 35.3%. Similarly, the statistical analysis conducted on geographies consisting of 96,460,010 people shows a mild negative correlation between the proportion of German Russians and percentage of population with at least bachelor's degree education in the United States with a correlation coefficient (R) of -0.345 and weighted average of 35.8%, a difference of 1.6%.
Bachelor's Degree Correlation Summary
| Measurement | White/Caucasian | German Russian |
| Minimum | 10.4% | 2.8% |
| Maximum | 42.1% | 65.8% |
| Range | 31.7% | 63.0% |
| Mean | 31.0% | 25.7% |
| Median | 31.9% | 26.4% |
| Interquartile 25% (IQ1) | 24.9% | 18.0% |
| Interquartile 75% (IQ3) | 37.3% | 34.3% |
| Interquartile Range (IQR) | 12.4% | 16.3% |
| Standard Deviation (Sample) | 7.1% | 12.5% |
| Standard Deviation (Population) | 7.1% | 12.3% |
Demographics Similar to Whites/Caucasians and German Russians by Bachelor's Degree
In terms of bachelor's degree, the demographic groups most similar to Whites/Caucasians are Immigrants from Trinidad and Tobago (35.3%, a difference of 0.080%), Ecuadorian (35.4%, a difference of 0.31%), Portuguese (35.5%, a difference of 0.57%), Immigrants from Burma/Myanmar (35.5%, a difference of 0.61%), and Immigrants from Barbados (35.5%, a difference of 0.68%). Similarly, the demographic groups most similar to German Russians are Subsaharan African (35.8%, a difference of 0.10%), West Indian (35.8%, a difference of 0.13%), Spanish (35.8%, a difference of 0.17%), Dutch (35.7%, a difference of 0.28%), and Trinidadian and Tobagonian (35.7%, a difference of 0.42%).
| Demographics | Rating | Rank | Bachelor's Degree |
| Immigrants | Panama | 14.2 /100 | #213 | Poor 36.2% |
| Germans | 13.9 /100 | #214 | Poor 36.1% |
| Immigrants | Western Africa | 13.8 /100 | #215 | Poor 36.1% |
| Barbadians | 13.5 /100 | #216 | Poor 36.1% |
| German Russians | 10.2 /100 | #217 | Poor 35.8% |
| Sub-Saharan Africans | 9.8 /100 | #218 | Tragic 35.8% |
| West Indians | 9.7 /100 | #219 | Tragic 35.8% |
| Spanish | 9.6 /100 | #220 | Tragic 35.8% |
| Dutch | 9.2 /100 | #221 | Tragic 35.7% |
| Trinidadians and Tobagonians | 8.8 /100 | #222 | Tragic 35.7% |
| French Canadians | 8.3 /100 | #223 | Tragic 35.6% |
| Immigrants | Barbados | 7.5 /100 | #224 | Tragic 35.5% |
| Immigrants | Burma/Myanmar | 7.3 /100 | #225 | Tragic 35.5% |
| Portuguese | 7.2 /100 | #226 | Tragic 35.5% |
| Ecuadorians | 6.6 /100 | #227 | Tragic 35.4% |
| Immigrants | Trinidad and Tobago | 6.0 /100 | #228 | Tragic 35.3% |
| Whites/Caucasians | 5.9 /100 | #229 | Tragic 35.3% |
| Immigrants | Grenada | 4.3 /100 | #230 | Tragic 35.0% |
| Immigrants | St. Vincent and the Grenadines | 4.3 /100 | #231 | Tragic 35.0% |
| Hmong | 3.4 /100 | #232 | Tragic 34.8% |
| Immigrants | Ecuador | 3.3 /100 | #233 | Tragic 34.7% |