Immigrants from the Azores vs Immigrants from Ethiopia College, 1 year or more
COMPARE
Immigrants from the Azores
Immigrants from Ethiopia
College, 1 year or more
College, 1 year or more Comparison
Immigrants from the Azores
Immigrants from Ethiopia
48.4%
COLLEGE, 1 YEAR OR MORE
0.0/ 100
METRIC RATING
339th/ 347
METRIC RANK
62.6%
COLLEGE, 1 YEAR OR MORE
98.2/ 100
METRIC RATING
89th/ 347
METRIC RANK
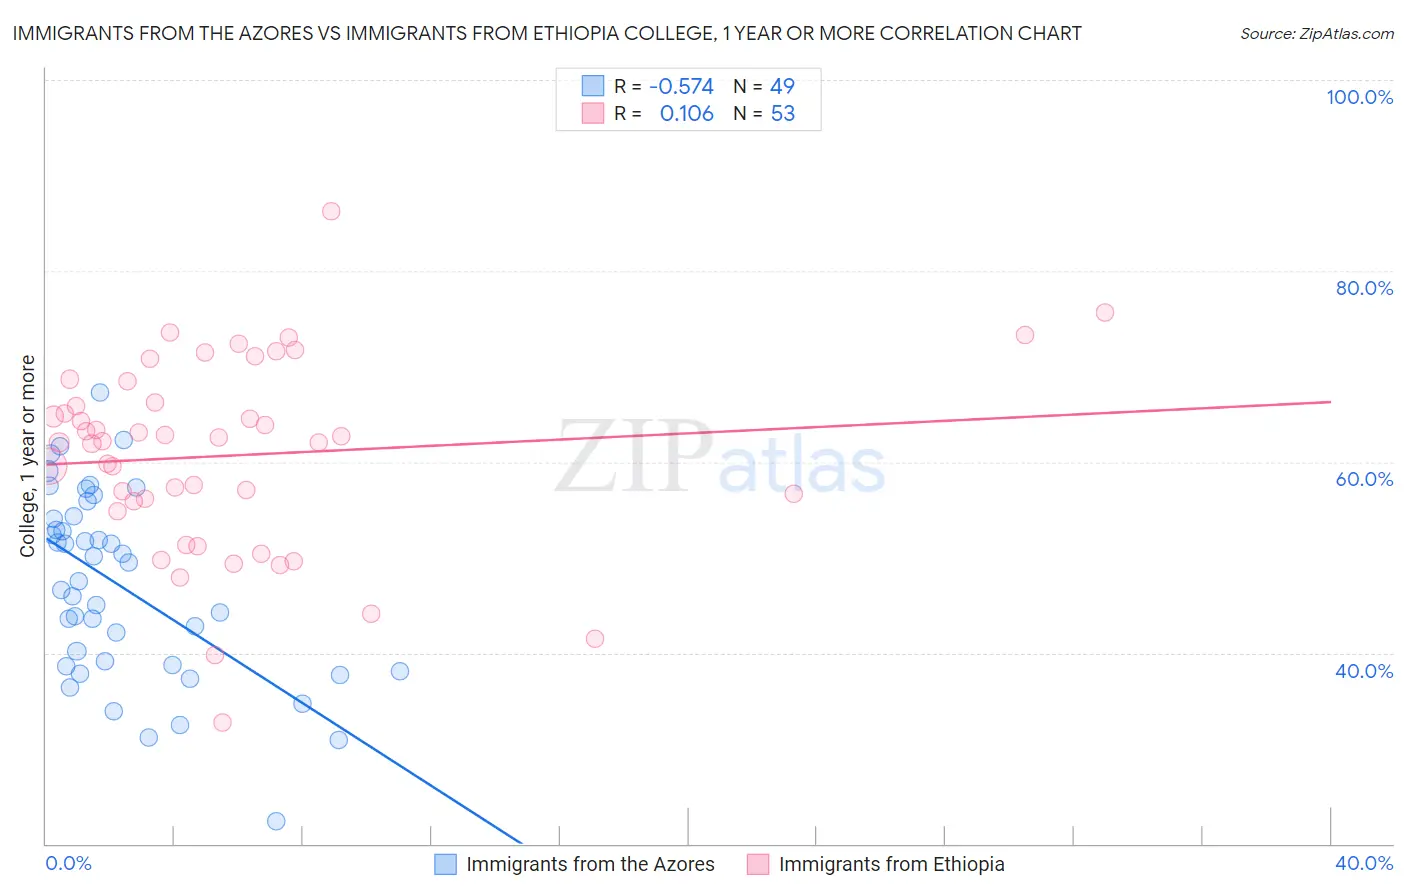
Immigrants from the Azores vs Immigrants from Ethiopia College, 1 year or more Correlation Chart
The statistical analysis conducted on geographies consisting of 46,257,310 people shows a substantial negative correlation between the proportion of Immigrants from the Azores and percentage of population with at least college, 1 year or more education in the United States with a correlation coefficient (R) of -0.574 and weighted average of 48.4%. Similarly, the statistical analysis conducted on geographies consisting of 211,551,397 people shows a poor positive correlation between the proportion of Immigrants from Ethiopia and percentage of population with at least college, 1 year or more education in the United States with a correlation coefficient (R) of 0.106 and weighted average of 62.6%, a difference of 29.4%.
College, 1 year or more Correlation Summary
| Measurement | Immigrants from the Azores | Immigrants from Ethiopia |
| Minimum | 22.4% | 32.7% |
| Maximum | 67.3% | 86.2% |
| Range | 44.9% | 53.5% |
| Mean | 47.0% | 60.7% |
| Median | 47.5% | 62.2% |
| Interquartile 25% (IQ1) | 38.7% | 55.3% |
| Interquartile 75% (IQ3) | 54.2% | 67.3% |
| Interquartile Range (IQR) | 15.5% | 12.0% |
| Standard Deviation (Sample) | 9.8% | 10.1% |
| Standard Deviation (Population) | 9.7% | 10.0% |
Similar Demographics by College, 1 year or more
Demographics Similar to Immigrants from the Azores by College, 1 year or more
In terms of college, 1 year or more, the demographic groups most similar to Immigrants from the Azores are Immigrants from Central America (48.5%, a difference of 0.26%), Pennsylvania German (48.5%, a difference of 0.31%), Spanish American Indian (48.5%, a difference of 0.32%), Immigrants from Cabo Verde (48.1%, a difference of 0.57%), and Yuman (48.7%, a difference of 0.76%).
| Demographics | Rating | Rank | College, 1 year or more |
| Mexicans | 0.0 /100 | #332 | Tragic 49.2% |
| Immigrants | Dominican Republic | 0.0 /100 | #333 | Tragic 49.1% |
| Lumbee | 0.0 /100 | #334 | Tragic 48.9% |
| Yuman | 0.0 /100 | #335 | Tragic 48.7% |
| Spanish American Indians | 0.0 /100 | #336 | Tragic 48.5% |
| Pennsylvania Germans | 0.0 /100 | #337 | Tragic 48.5% |
| Immigrants | Central America | 0.0 /100 | #338 | Tragic 48.5% |
| Immigrants | Azores | 0.0 /100 | #339 | Tragic 48.4% |
| Immigrants | Cabo Verde | 0.0 /100 | #340 | Tragic 48.1% |
| Immigrants | Mexico | 0.0 /100 | #341 | Tragic 47.5% |
| Inupiat | 0.0 /100 | #342 | Tragic 47.2% |
| Tohono O'odham | 0.0 /100 | #343 | Tragic 47.1% |
| Yakama | 0.0 /100 | #344 | Tragic 46.2% |
| Pima | 0.0 /100 | #345 | Tragic 45.6% |
| Houma | 0.0 /100 | #346 | Tragic 41.2% |
Demographics Similar to Immigrants from Ethiopia by College, 1 year or more
In terms of college, 1 year or more, the demographic groups most similar to Immigrants from Ethiopia are Greek (62.6%, a difference of 0.10%), Immigrants from Western Asia (62.5%, a difference of 0.17%), Immigrants from Hungary (62.7%, a difference of 0.27%), Immigrants from Eastern Europe (62.4%, a difference of 0.28%), and Immigrants from Western Europe (62.7%, a difference of 0.29%).
| Demographics | Rating | Rank | College, 1 year or more |
| Immigrants | Bolivia | 98.7 /100 | #82 | Exceptional 62.8% |
| Immigrants | Argentina | 98.6 /100 | #83 | Exceptional 62.8% |
| Immigrants | England | 98.6 /100 | #84 | Exceptional 62.8% |
| Immigrants | Pakistan | 98.6 /100 | #85 | Exceptional 62.8% |
| Immigrants | Western Europe | 98.6 /100 | #86 | Exceptional 62.7% |
| Immigrants | Hungary | 98.6 /100 | #87 | Exceptional 62.7% |
| Greeks | 98.3 /100 | #88 | Exceptional 62.6% |
| Immigrants | Ethiopia | 98.2 /100 | #89 | Exceptional 62.6% |
| Immigrants | Western Asia | 97.9 /100 | #90 | Exceptional 62.5% |
| Immigrants | Eastern Europe | 97.8 /100 | #91 | Exceptional 62.4% |
| Immigrants | Egypt | 97.8 /100 | #92 | Exceptional 62.4% |
| Romanians | 97.7 /100 | #93 | Exceptional 62.4% |
| Immigrants | Croatia | 97.6 /100 | #94 | Exceptional 62.3% |
| British | 97.4 /100 | #95 | Exceptional 62.3% |
| Chinese | 97.2 /100 | #96 | Exceptional 62.2% |