Kiowa vs Immigrants from Ethiopia College, 1 year or more
COMPARE
Kiowa
Immigrants from Ethiopia
College, 1 year or more
College, 1 year or more Comparison
Kiowa
Immigrants from Ethiopia
51.0%
COLLEGE, 1 YEAR OR MORE
0.0/ 100
METRIC RATING
320th/ 347
METRIC RANK
62.6%
COLLEGE, 1 YEAR OR MORE
98.2/ 100
METRIC RATING
89th/ 347
METRIC RANK
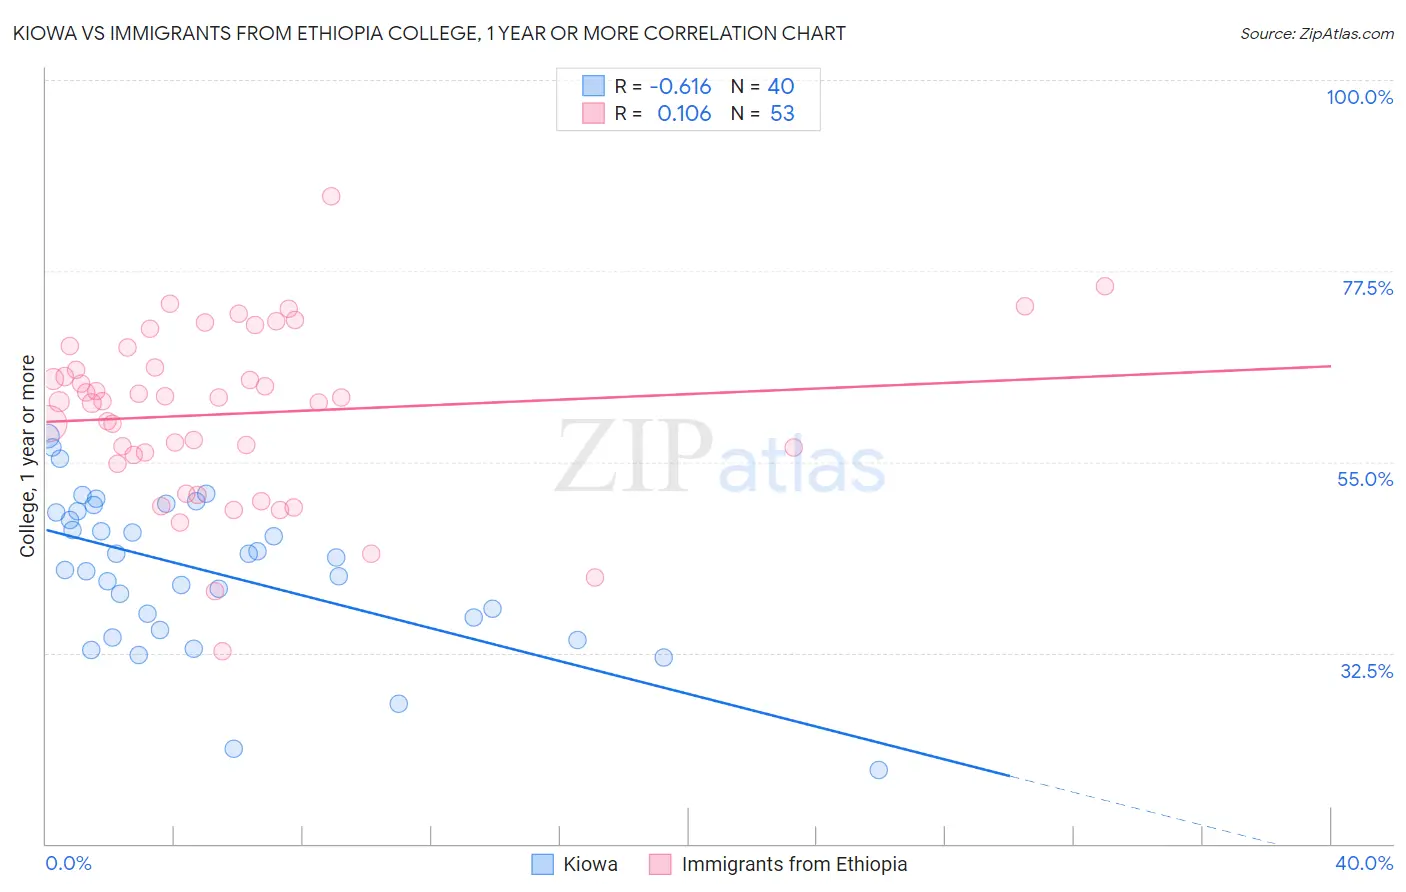
Kiowa vs Immigrants from Ethiopia College, 1 year or more Correlation Chart
The statistical analysis conducted on geographies consisting of 56,101,444 people shows a significant negative correlation between the proportion of Kiowa and percentage of population with at least college, 1 year or more education in the United States with a correlation coefficient (R) of -0.616 and weighted average of 51.0%. Similarly, the statistical analysis conducted on geographies consisting of 211,551,397 people shows a poor positive correlation between the proportion of Immigrants from Ethiopia and percentage of population with at least college, 1 year or more education in the United States with a correlation coefficient (R) of 0.106 and weighted average of 62.6%, a difference of 22.8%.
College, 1 year or more Correlation Summary
| Measurement | Kiowa | Immigrants from Ethiopia |
| Minimum | 18.8% | 32.7% |
| Maximum | 58.1% | 86.2% |
| Range | 39.3% | 53.5% |
| Mean | 42.0% | 60.7% |
| Median | 43.0% | 62.2% |
| Interquartile 25% (IQ1) | 35.9% | 55.3% |
| Interquartile 75% (IQ3) | 49.1% | 67.3% |
| Interquartile Range (IQR) | 13.2% | 12.0% |
| Standard Deviation (Sample) | 9.0% | 10.1% |
| Standard Deviation (Population) | 8.9% | 10.0% |
Similar Demographics by College, 1 year or more
Demographics Similar to Kiowa by College, 1 year or more
In terms of college, 1 year or more, the demographic groups most similar to Kiowa are Immigrants from El Salvador (51.0%, a difference of 0.060%), Hopi (50.9%, a difference of 0.12%), Immigrants from Honduras (51.0%, a difference of 0.15%), Hispanic or Latino (51.1%, a difference of 0.28%), and Navajo (50.8%, a difference of 0.31%).
| Demographics | Rating | Rank | College, 1 year or more |
| Immigrants | Caribbean | 0.0 /100 | #313 | Tragic 51.4% |
| Fijians | 0.0 /100 | #314 | Tragic 51.3% |
| Guatemalans | 0.0 /100 | #315 | Tragic 51.2% |
| Cajuns | 0.0 /100 | #316 | Tragic 51.2% |
| Hispanics or Latinos | 0.0 /100 | #317 | Tragic 51.1% |
| Immigrants | Honduras | 0.0 /100 | #318 | Tragic 51.0% |
| Immigrants | El Salvador | 0.0 /100 | #319 | Tragic 51.0% |
| Kiowa | 0.0 /100 | #320 | Tragic 51.0% |
| Hopi | 0.0 /100 | #321 | Tragic 50.9% |
| Navajo | 0.0 /100 | #322 | Tragic 50.8% |
| Immigrants | Guatemala | 0.0 /100 | #323 | Tragic 50.7% |
| Immigrants | Cuba | 0.0 /100 | #324 | Tragic 50.7% |
| Immigrants | Latin America | 0.0 /100 | #325 | Tragic 50.7% |
| Dominicans | 0.0 /100 | #326 | Tragic 50.6% |
| Menominee | 0.0 /100 | #327 | Tragic 50.6% |
Demographics Similar to Immigrants from Ethiopia by College, 1 year or more
In terms of college, 1 year or more, the demographic groups most similar to Immigrants from Ethiopia are Greek (62.6%, a difference of 0.10%), Immigrants from Western Asia (62.5%, a difference of 0.17%), Immigrants from Hungary (62.7%, a difference of 0.27%), Immigrants from Eastern Europe (62.4%, a difference of 0.28%), and Immigrants from Western Europe (62.7%, a difference of 0.29%).
| Demographics | Rating | Rank | College, 1 year or more |
| Immigrants | Bolivia | 98.7 /100 | #82 | Exceptional 62.8% |
| Immigrants | Argentina | 98.6 /100 | #83 | Exceptional 62.8% |
| Immigrants | England | 98.6 /100 | #84 | Exceptional 62.8% |
| Immigrants | Pakistan | 98.6 /100 | #85 | Exceptional 62.8% |
| Immigrants | Western Europe | 98.6 /100 | #86 | Exceptional 62.7% |
| Immigrants | Hungary | 98.6 /100 | #87 | Exceptional 62.7% |
| Greeks | 98.3 /100 | #88 | Exceptional 62.6% |
| Immigrants | Ethiopia | 98.2 /100 | #89 | Exceptional 62.6% |
| Immigrants | Western Asia | 97.9 /100 | #90 | Exceptional 62.5% |
| Immigrants | Eastern Europe | 97.8 /100 | #91 | Exceptional 62.4% |
| Immigrants | Egypt | 97.8 /100 | #92 | Exceptional 62.4% |
| Romanians | 97.7 /100 | #93 | Exceptional 62.4% |
| Immigrants | Croatia | 97.6 /100 | #94 | Exceptional 62.3% |
| British | 97.4 /100 | #95 | Exceptional 62.3% |
| Chinese | 97.2 /100 | #96 | Exceptional 62.2% |