Slovak vs Finnish College, Under 1 year
COMPARE
Slovak
Finnish
College, Under 1 year
College, Under 1 year Comparison
Slovaks
Finns
64.7%
COLLEGE, UNDER 1 YEAR
26.7/ 100
METRIC RATING
193rd/ 347
METRIC RANK
66.9%
COLLEGE, UNDER 1 YEAR
88.6/ 100
METRIC RATING
131st/ 347
METRIC RANK
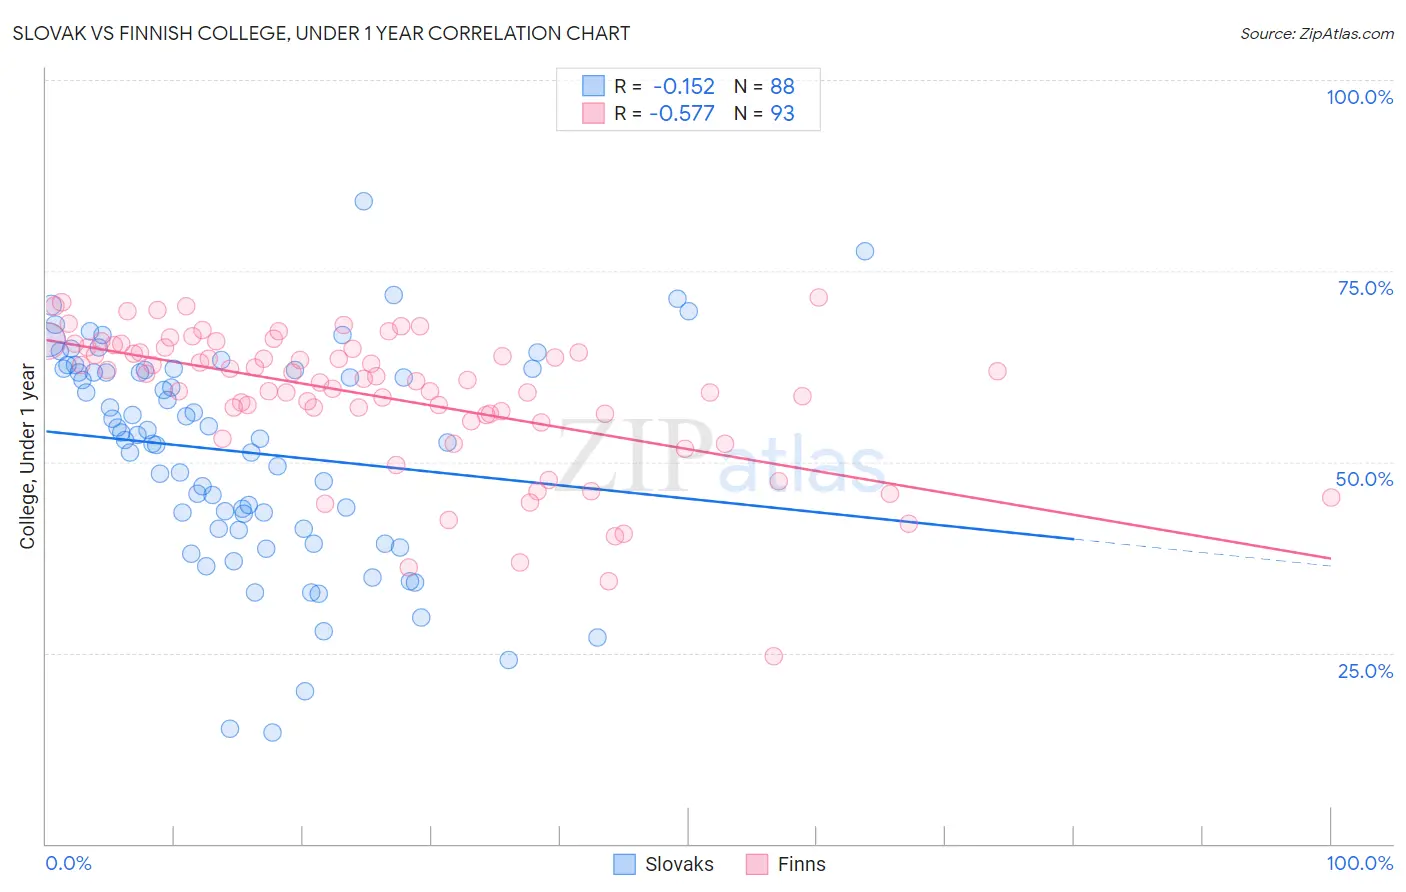
Slovak vs Finnish College, Under 1 year Correlation Chart
The statistical analysis conducted on geographies consisting of 397,891,856 people shows a poor negative correlation between the proportion of Slovaks and percentage of population with at least college, under 1 year education in the United States with a correlation coefficient (R) of -0.152 and weighted average of 64.7%. Similarly, the statistical analysis conducted on geographies consisting of 404,673,530 people shows a substantial negative correlation between the proportion of Finns and percentage of population with at least college, under 1 year education in the United States with a correlation coefficient (R) of -0.577 and weighted average of 66.9%, a difference of 3.4%.
College, Under 1 year Correlation Summary
| Measurement | Slovak | Finnish |
| Minimum | 14.5% | 24.5% |
| Maximum | 84.1% | 71.6% |
| Range | 69.5% | 47.0% |
| Mean | 51.3% | 58.5% |
| Median | 53.3% | 60.9% |
| Interquartile 25% (IQ1) | 41.2% | 55.8% |
| Interquartile 75% (IQ3) | 62.0% | 64.9% |
| Interquartile Range (IQR) | 20.8% | 9.1% |
| Standard Deviation (Sample) | 14.1% | 9.3% |
| Standard Deviation (Population) | 14.0% | 9.2% |
Similar Demographics by College, Under 1 year
Demographics Similar to Slovaks by College, Under 1 year
In terms of college, under 1 year, the demographic groups most similar to Slovaks are Immigrants from Thailand (64.7%, a difference of 0.020%), Immigrants from Armenia (64.7%, a difference of 0.070%), Immigrants from Cameroon (64.6%, a difference of 0.13%), Immigrants from Philippines (64.8%, a difference of 0.19%), and Spanish (64.9%, a difference of 0.26%).
| Demographics | Rating | Rank | College, Under 1 year |
| Immigrants | Sierra Leone | 39.7 /100 | #186 | Fair 65.1% |
| Immigrants | Southern Europe | 34.3 /100 | #187 | Fair 64.9% |
| Immigrants | Albania | 32.0 /100 | #188 | Fair 64.9% |
| Spanish | 31.6 /100 | #189 | Fair 64.9% |
| Immigrants | Philippines | 30.1 /100 | #190 | Fair 64.8% |
| Immigrants | Armenia | 28.1 /100 | #191 | Fair 64.7% |
| Immigrants | Thailand | 27.0 /100 | #192 | Fair 64.7% |
| Slovaks | 26.7 /100 | #193 | Fair 64.7% |
| Immigrants | Cameroon | 24.6 /100 | #194 | Fair 64.6% |
| Immigrants | South Eastern Asia | 22.1 /100 | #195 | Fair 64.5% |
| Tongans | 21.2 /100 | #196 | Fair 64.5% |
| Costa Ricans | 19.6 /100 | #197 | Poor 64.4% |
| Tsimshian | 17.9 /100 | #198 | Poor 64.3% |
| Panamanians | 17.0 /100 | #199 | Poor 64.3% |
| Nigerians | 16.7 /100 | #200 | Poor 64.3% |
Demographics Similar to Finns by College, Under 1 year
In terms of college, under 1 year, the demographic groups most similar to Finns are Polish (66.9%, a difference of 0.020%), Immigrants from Brazil (66.9%, a difference of 0.030%), Immigrants from Syria (66.9%, a difference of 0.040%), Iraqi (66.8%, a difference of 0.060%), and Canadian (66.8%, a difference of 0.070%).
| Demographics | Rating | Rank | College, Under 1 year |
| Arabs | 92.6 /100 | #124 | Exceptional 67.2% |
| Italians | 91.8 /100 | #125 | Exceptional 67.2% |
| Alsatians | 91.3 /100 | #126 | Exceptional 67.1% |
| Czechs | 90.8 /100 | #127 | Exceptional 67.1% |
| Scottish | 90.2 /100 | #128 | Exceptional 67.0% |
| Immigrants | Eastern Africa | 89.5 /100 | #129 | Excellent 67.0% |
| Immigrants | Syria | 89.0 /100 | #130 | Excellent 66.9% |
| Finns | 88.6 /100 | #131 | Excellent 66.9% |
| Poles | 88.4 /100 | #132 | Excellent 66.9% |
| Immigrants | Brazil | 88.3 /100 | #133 | Excellent 66.9% |
| Iraqis | 88.0 /100 | #134 | Excellent 66.8% |
| Canadians | 87.9 /100 | #135 | Excellent 66.8% |
| Ugandans | 87.8 /100 | #136 | Excellent 66.8% |
| Immigrants | Chile | 87.4 /100 | #137 | Excellent 66.8% |
| Immigrants | Italy | 86.9 /100 | #138 | Excellent 66.8% |