Immigrants from North America vs Swedish Professional Degree
COMPARE
Immigrants from North America
Swedish
Professional Degree
Professional Degree Comparison
Immigrants from North America
Swedes
5.3%
PROFESSIONAL DEGREE
99.7/ 100
METRIC RATING
79th/ 347
METRIC RANK
4.5%
PROFESSIONAL DEGREE
69.9/ 100
METRIC RATING
156th/ 347
METRIC RANK
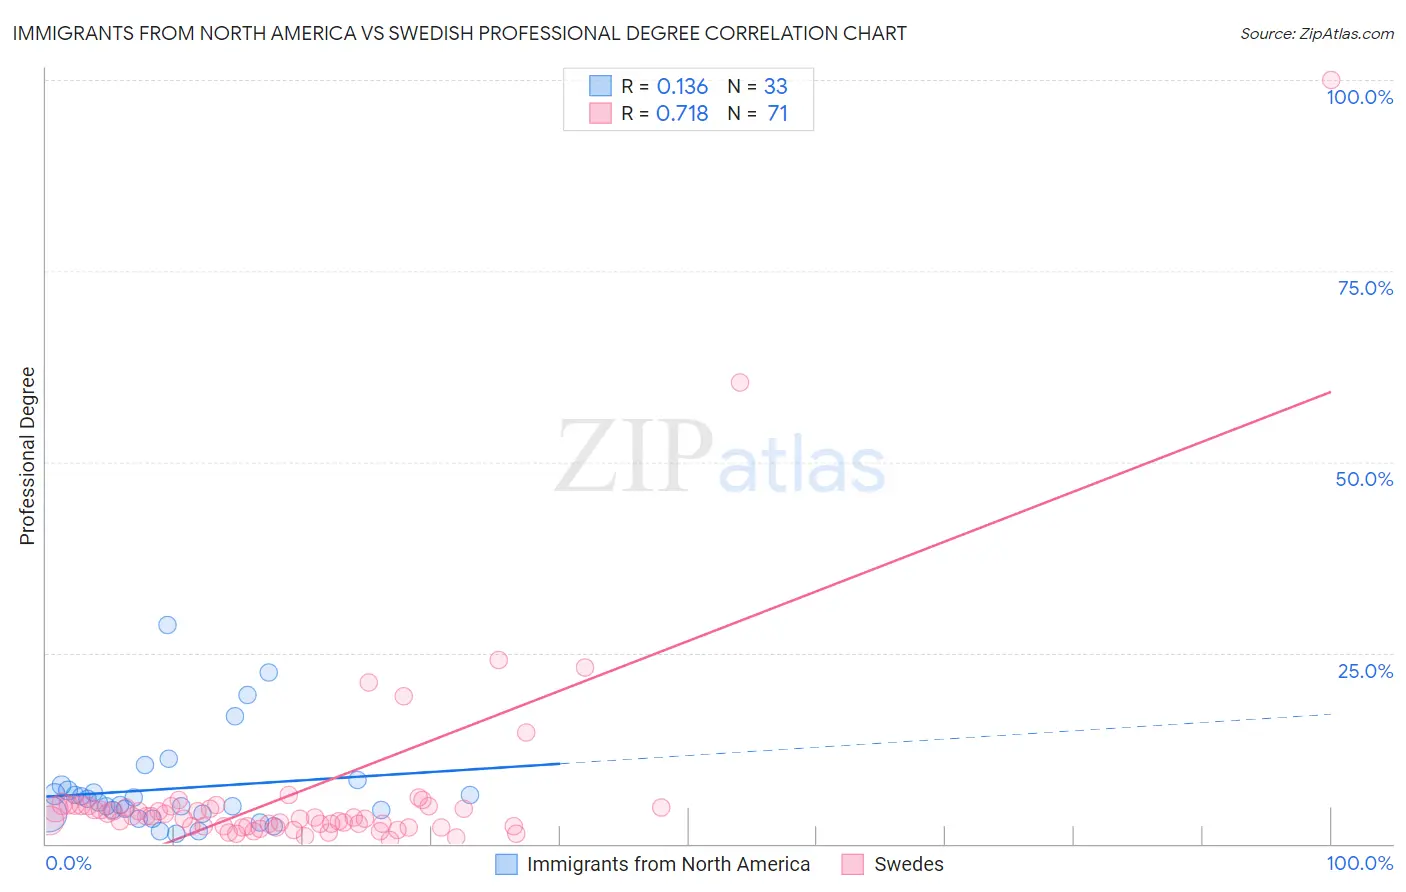
Immigrants from North America vs Swedish Professional Degree Correlation Chart
The statistical analysis conducted on geographies consisting of 460,954,091 people shows a poor positive correlation between the proportion of Immigrants from North America and percentage of population with at least professional degree education in the United States with a correlation coefficient (R) of 0.136 and weighted average of 5.3%. Similarly, the statistical analysis conducted on geographies consisting of 533,979,460 people shows a strong positive correlation between the proportion of Swedes and percentage of population with at least professional degree education in the United States with a correlation coefficient (R) of 0.718 and weighted average of 4.5%, a difference of 17.4%.
Professional Degree Correlation Summary
| Measurement | Immigrants from North America | Swedish |
| Minimum | 1.3% | 0.57% |
| Maximum | 28.7% | 100.0% |
| Range | 27.4% | 99.4% |
| Mean | 7.2% | 6.7% |
| Median | 5.5% | 3.5% |
| Interquartile 25% (IQ1) | 3.9% | 2.3% |
| Interquartile 75% (IQ3) | 7.3% | 5.0% |
| Interquartile Range (IQR) | 3.3% | 2.7% |
| Standard Deviation (Sample) | 6.1% | 13.9% |
| Standard Deviation (Population) | 6.0% | 13.8% |
Similar Demographics by Professional Degree
Demographics Similar to Immigrants from North America by Professional Degree
In terms of professional degree, the demographic groups most similar to Immigrants from North America are Armenian (5.3%, a difference of 0.17%), Immigrants from Ethiopia (5.3%, a difference of 0.22%), Immigrants from Canada (5.3%, a difference of 0.26%), Immigrants from Indonesia (5.3%, a difference of 0.35%), and Immigrants from England (5.3%, a difference of 0.39%).
| Demographics | Rating | Rank | Professional Degree |
| Lithuanians | 99.8 /100 | #72 | Exceptional 5.4% |
| Immigrants | Romania | 99.8 /100 | #73 | Exceptional 5.4% |
| Ethiopians | 99.7 /100 | #74 | Exceptional 5.4% |
| Immigrants | Indonesia | 99.7 /100 | #75 | Exceptional 5.3% |
| Immigrants | Canada | 99.7 /100 | #76 | Exceptional 5.3% |
| Immigrants | Ethiopia | 99.7 /100 | #77 | Exceptional 5.3% |
| Armenians | 99.7 /100 | #78 | Exceptional 5.3% |
| Immigrants | North America | 99.7 /100 | #79 | Exceptional 5.3% |
| Immigrants | England | 99.6 /100 | #80 | Exceptional 5.3% |
| Immigrants | Brazil | 99.6 /100 | #81 | Exceptional 5.3% |
| Romanians | 99.6 /100 | #82 | Exceptional 5.3% |
| Carpatho Rusyns | 99.6 /100 | #83 | Exceptional 5.3% |
| Immigrants | Croatia | 99.6 /100 | #84 | Exceptional 5.3% |
| Immigrants | Zimbabwe | 99.6 /100 | #85 | Exceptional 5.3% |
| Greeks | 99.6 /100 | #86 | Exceptional 5.3% |
Demographics Similar to Swedes by Professional Degree
In terms of professional degree, the demographic groups most similar to Swedes are Iraqi (4.5%, a difference of 0.010%), Slavic (4.5%, a difference of 0.15%), Immigrants from Armenia (4.5%, a difference of 0.18%), Vietnamese (4.5%, a difference of 0.26%), and Immigrants from Senegal (4.5%, a difference of 0.32%).
| Demographics | Rating | Rank | Professional Degree |
| Senegalese | 75.3 /100 | #149 | Good 4.6% |
| Immigrants | Oceania | 73.4 /100 | #150 | Good 4.6% |
| Poles | 72.6 /100 | #151 | Good 4.6% |
| Immigrants | Africa | 72.5 /100 | #152 | Good 4.6% |
| Immigrants | Uruguay | 72.5 /100 | #153 | Good 4.6% |
| Scottish | 71.8 /100 | #154 | Good 4.6% |
| Slavs | 70.8 /100 | #155 | Good 4.5% |
| Swedes | 69.9 /100 | #156 | Good 4.5% |
| Iraqis | 69.8 /100 | #157 | Good 4.5% |
| Immigrants | Armenia | 68.8 /100 | #158 | Good 4.5% |
| Vietnamese | 68.4 /100 | #159 | Good 4.5% |
| Immigrants | Senegal | 68.0 /100 | #160 | Good 4.5% |
| Assyrians/Chaldeans/Syriacs | 67.4 /100 | #161 | Good 4.5% |
| Peruvians | 65.2 /100 | #162 | Good 4.5% |
| Sierra Leoneans | 64.3 /100 | #163 | Good 4.5% |