Spanish American Indian vs Swedish Professional Degree
COMPARE
Spanish American Indian
Swedish
Professional Degree
Professional Degree Comparison
Spanish American Indians
Swedes
2.7%
PROFESSIONAL DEGREE
0.0/ 100
METRIC RATING
344th/ 347
METRIC RANK
4.5%
PROFESSIONAL DEGREE
69.9/ 100
METRIC RATING
156th/ 347
METRIC RANK
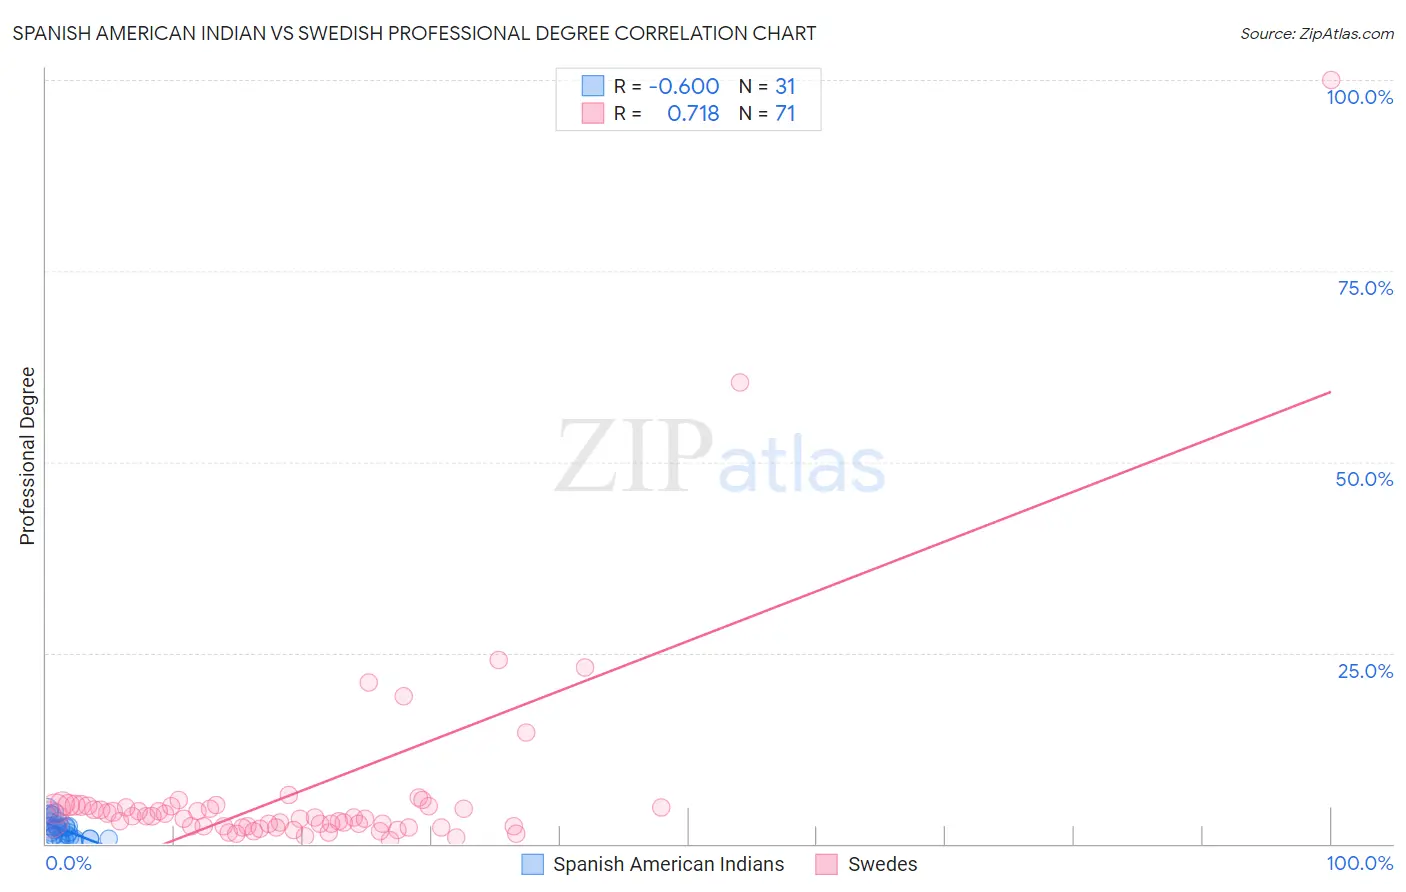
Spanish American Indian vs Swedish Professional Degree Correlation Chart
The statistical analysis conducted on geographies consisting of 73,088,569 people shows a significant negative correlation between the proportion of Spanish American Indians and percentage of population with at least professional degree education in the United States with a correlation coefficient (R) of -0.600 and weighted average of 2.7%. Similarly, the statistical analysis conducted on geographies consisting of 533,979,460 people shows a strong positive correlation between the proportion of Swedes and percentage of population with at least professional degree education in the United States with a correlation coefficient (R) of 0.718 and weighted average of 4.5%, a difference of 71.2%.
Professional Degree Correlation Summary
| Measurement | Spanish American Indian | Swedish |
| Minimum | 0.32% | 0.57% |
| Maximum | 4.4% | 100.0% |
| Range | 4.1% | 99.4% |
| Mean | 1.9% | 6.7% |
| Median | 1.9% | 3.5% |
| Interquartile 25% (IQ1) | 0.71% | 2.3% |
| Interquartile 75% (IQ3) | 2.4% | 5.0% |
| Interquartile Range (IQR) | 1.7% | 2.7% |
| Standard Deviation (Sample) | 1.2% | 13.9% |
| Standard Deviation (Population) | 1.2% | 13.8% |
Similar Demographics by Professional Degree
Demographics Similar to Spanish American Indians by Professional Degree
In terms of professional degree, the demographic groups most similar to Spanish American Indians are Immigrants from Mexico (2.6%, a difference of 0.32%), Mexican (2.7%, a difference of 3.6%), Immigrants from the Azores (2.8%, a difference of 6.6%), Tohono O'odham (2.8%, a difference of 7.3%), and Lumbee (2.5%, a difference of 7.7%).
| Demographics | Rating | Rank | Professional Degree |
| Puget Sound Salish | 0.0 /100 | #333 | Tragic 3.1% |
| Pennsylvania Germans | 0.0 /100 | #334 | Tragic 3.0% |
| Natives/Alaskans | 0.0 /100 | #335 | Tragic 3.0% |
| Fijians | 0.0 /100 | #336 | Tragic 2.9% |
| Arapaho | 0.0 /100 | #337 | Tragic 2.9% |
| Navajo | 0.0 /100 | #338 | Tragic 2.9% |
| Immigrants | Central America | 0.0 /100 | #339 | Tragic 2.9% |
| Yup'ik | 0.0 /100 | #340 | Tragic 2.9% |
| Tohono O'odham | 0.0 /100 | #341 | Tragic 2.8% |
| Immigrants | Azores | 0.0 /100 | #342 | Tragic 2.8% |
| Mexicans | 0.0 /100 | #343 | Tragic 2.7% |
| Spanish American Indians | 0.0 /100 | #344 | Tragic 2.7% |
| Immigrants | Mexico | 0.0 /100 | #345 | Tragic 2.6% |
| Lumbee | 0.0 /100 | #346 | Tragic 2.5% |
| Houma | 0.0 /100 | #347 | Tragic 2.2% |
Demographics Similar to Swedes by Professional Degree
In terms of professional degree, the demographic groups most similar to Swedes are Iraqi (4.5%, a difference of 0.010%), Slavic (4.5%, a difference of 0.15%), Immigrants from Armenia (4.5%, a difference of 0.18%), Vietnamese (4.5%, a difference of 0.26%), and Immigrants from Senegal (4.5%, a difference of 0.32%).
| Demographics | Rating | Rank | Professional Degree |
| Senegalese | 75.3 /100 | #149 | Good 4.6% |
| Immigrants | Oceania | 73.4 /100 | #150 | Good 4.6% |
| Poles | 72.6 /100 | #151 | Good 4.6% |
| Immigrants | Africa | 72.5 /100 | #152 | Good 4.6% |
| Immigrants | Uruguay | 72.5 /100 | #153 | Good 4.6% |
| Scottish | 71.8 /100 | #154 | Good 4.6% |
| Slavs | 70.8 /100 | #155 | Good 4.5% |
| Swedes | 69.9 /100 | #156 | Good 4.5% |
| Iraqis | 69.8 /100 | #157 | Good 4.5% |
| Immigrants | Armenia | 68.8 /100 | #158 | Good 4.5% |
| Vietnamese | 68.4 /100 | #159 | Good 4.5% |
| Immigrants | Senegal | 68.0 /100 | #160 | Good 4.5% |
| Assyrians/Chaldeans/Syriacs | 67.4 /100 | #161 | Good 4.5% |
| Peruvians | 65.2 /100 | #162 | Good 4.5% |
| Sierra Leoneans | 64.3 /100 | #163 | Good 4.5% |