Welsh vs Basque 11th Grade
COMPARE
Welsh
Basque
11th Grade
11th Grade Comparison
Welsh
Basques
94.2%
11TH GRADE
99.9/ 100
METRIC RATING
31st/ 347
METRIC RANK
93.2%
11TH GRADE
95.2/ 100
METRIC RATING
126th/ 347
METRIC RANK
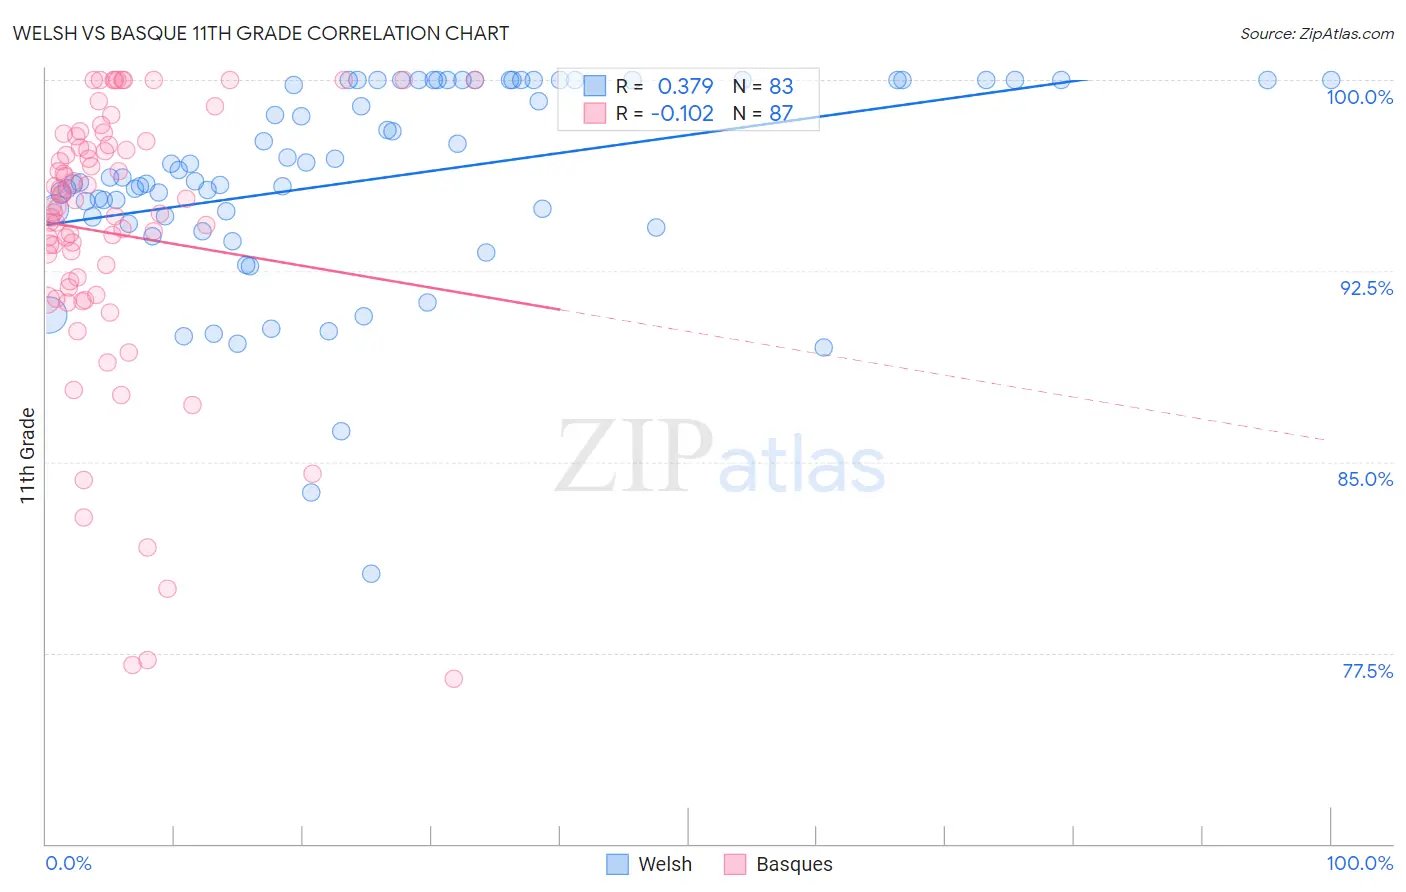
Welsh vs Basque 11th Grade Correlation Chart
The statistical analysis conducted on geographies consisting of 528,596,196 people shows a mild positive correlation between the proportion of Welsh and percentage of population with at least 11th grade education in the United States with a correlation coefficient (R) of 0.379 and weighted average of 94.2%. Similarly, the statistical analysis conducted on geographies consisting of 165,777,136 people shows a poor negative correlation between the proportion of Basques and percentage of population with at least 11th grade education in the United States with a correlation coefficient (R) of -0.102 and weighted average of 93.2%, a difference of 1.1%.
11th Grade Correlation Summary
| Measurement | Welsh | Basque |
| Minimum | 80.6% | 76.5% |
| Maximum | 100.0% | 100.0% |
| Range | 19.4% | 23.5% |
| Mean | 96.1% | 94.0% |
| Median | 96.2% | 95.0% |
| Interquartile 25% (IQ1) | 94.6% | 91.9% |
| Interquartile 75% (IQ3) | 100.0% | 97.5% |
| Interquartile Range (IQR) | 5.4% | 5.6% |
| Standard Deviation (Sample) | 4.0% | 5.4% |
| Standard Deviation (Population) | 4.0% | 5.4% |
Similar Demographics by 11th Grade
Demographics Similar to Welsh by 11th Grade
In terms of 11th grade, the demographic groups most similar to Welsh are Belgian (94.2%, a difference of 0.0%), Russian (94.3%, a difference of 0.020%), British (94.2%, a difference of 0.040%), Immigrants from Scotland (94.2%, a difference of 0.040%), and Immigrants from Singapore (94.2%, a difference of 0.050%).
| Demographics | Rating | Rank | 11th Grade |
| English | 100.0 /100 | #24 | Exceptional 94.4% |
| Irish | 100.0 /100 | #25 | Exceptional 94.4% |
| Scottish | 100.0 /100 | #26 | Exceptional 94.4% |
| Europeans | 100.0 /100 | #27 | Exceptional 94.4% |
| Estonians | 100.0 /100 | #28 | Exceptional 94.4% |
| Dutch | 100.0 /100 | #29 | Exceptional 94.3% |
| Russians | 100.0 /100 | #30 | Exceptional 94.3% |
| Welsh | 99.9 /100 | #31 | Exceptional 94.2% |
| Belgians | 99.9 /100 | #32 | Exceptional 94.2% |
| British | 99.9 /100 | #33 | Exceptional 94.2% |
| Immigrants | Scotland | 99.9 /100 | #34 | Exceptional 94.2% |
| Immigrants | Singapore | 99.9 /100 | #35 | Exceptional 94.2% |
| Immigrants | Northern Europe | 99.9 /100 | #36 | Exceptional 94.2% |
| Northern Europeans | 99.9 /100 | #37 | Exceptional 94.2% |
| Hungarians | 99.9 /100 | #38 | Exceptional 94.2% |
Demographics Similar to Basques by 11th Grade
In terms of 11th grade, the demographic groups most similar to Basques are Immigrants from Sri Lanka (93.2%, a difference of 0.020%), Immigrants from Greece (93.2%, a difference of 0.040%), Immigrants from Eastern Europe (93.2%, a difference of 0.040%), German Russian (93.3%, a difference of 0.070%), and Immigrants from Belarus (93.3%, a difference of 0.070%).
| Demographics | Rating | Rank | 11th Grade |
| Israelis | 97.0 /100 | #119 | Exceptional 93.3% |
| Immigrants | Russia | 96.6 /100 | #120 | Exceptional 93.3% |
| German Russians | 96.4 /100 | #121 | Exceptional 93.3% |
| Immigrants | Belarus | 96.3 /100 | #122 | Exceptional 93.3% |
| Immigrants | Greece | 95.9 /100 | #123 | Exceptional 93.2% |
| Immigrants | Eastern Europe | 95.9 /100 | #124 | Exceptional 93.2% |
| Immigrants | Sri Lanka | 95.6 /100 | #125 | Exceptional 93.2% |
| Basques | 95.2 /100 | #126 | Exceptional 93.2% |
| Immigrants | Kazakhstan | 92.4 /100 | #127 | Exceptional 93.1% |
| Immigrants | Jordan | 92.4 /100 | #128 | Exceptional 93.1% |
| Immigrants | Ukraine | 89.8 /100 | #129 | Excellent 93.0% |
| Albanians | 89.5 /100 | #130 | Excellent 93.0% |
| Egyptians | 89.5 /100 | #131 | Excellent 93.0% |
| Immigrants | Bosnia and Herzegovina | 89.0 /100 | #132 | Excellent 93.0% |
| Mongolians | 87.6 /100 | #133 | Excellent 93.0% |