Welsh vs Immigrants from Pakistan 9th Grade
COMPARE
Welsh
Immigrants from Pakistan
9th Grade
9th Grade Comparison
Welsh
Immigrants from Pakistan
96.4%
9TH GRADE
100.0/ 100
METRIC RATING
19th/ 347
METRIC RANK
94.6%
9TH GRADE
15.5/ 100
METRIC RATING
208th/ 347
METRIC RANK
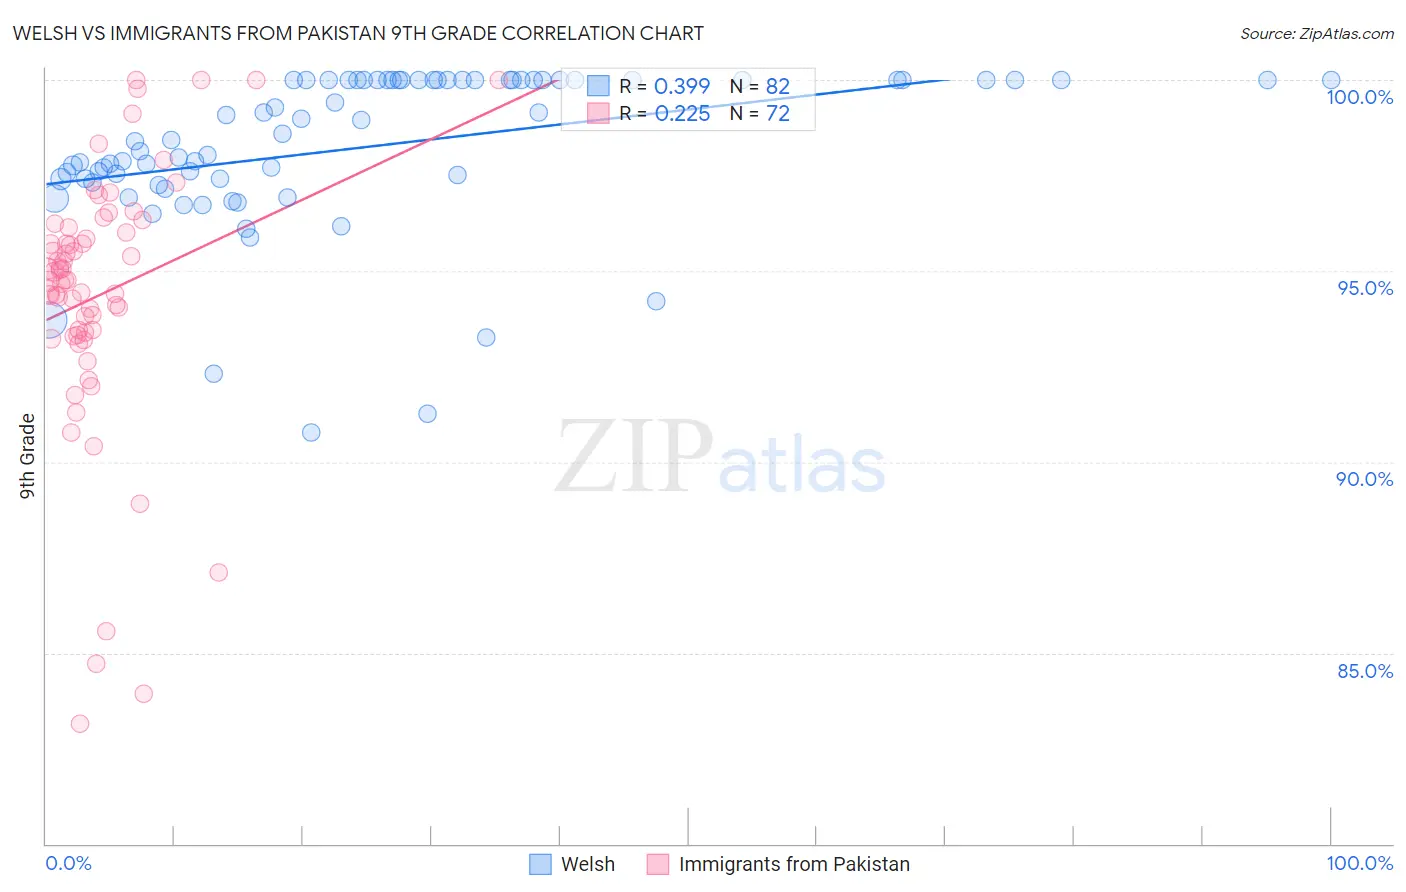
Welsh vs Immigrants from Pakistan 9th Grade Correlation Chart
The statistical analysis conducted on geographies consisting of 528,596,253 people shows a mild positive correlation between the proportion of Welsh and percentage of population with at least 9th grade education in the United States with a correlation coefficient (R) of 0.399 and weighted average of 96.4%. Similarly, the statistical analysis conducted on geographies consisting of 283,862,965 people shows a weak positive correlation between the proportion of Immigrants from Pakistan and percentage of population with at least 9th grade education in the United States with a correlation coefficient (R) of 0.225 and weighted average of 94.6%, a difference of 1.9%.
9th Grade Correlation Summary
| Measurement | Welsh | Immigrants from Pakistan |
| Minimum | 90.8% | 83.1% |
| Maximum | 100.0% | 100.0% |
| Range | 9.2% | 16.9% |
| Mean | 98.2% | 94.4% |
| Median | 98.5% | 94.8% |
| Interquartile 25% (IQ1) | 97.4% | 93.4% |
| Interquartile 75% (IQ3) | 100.0% | 96.1% |
| Interquartile Range (IQR) | 2.6% | 2.7% |
| Standard Deviation (Sample) | 2.1% | 3.4% |
| Standard Deviation (Population) | 2.1% | 3.4% |
Similar Demographics by 9th Grade
Demographics Similar to Welsh by 9th Grade
In terms of 9th grade, the demographic groups most similar to Welsh are Italian (96.4%, a difference of 0.0%), Alaskan Athabascan (96.4%, a difference of 0.020%), European (96.4%, a difference of 0.030%), Scandinavian (96.5%, a difference of 0.040%), and Czech (96.4%, a difference of 0.040%).
| Demographics | Rating | Rank | 9th Grade |
| English | 100.0 /100 | #12 | Exceptional 96.6% |
| Danes | 100.0 /100 | #13 | Exceptional 96.5% |
| Scottish | 100.0 /100 | #14 | Exceptional 96.5% |
| Irish | 100.0 /100 | #15 | Exceptional 96.5% |
| Croatians | 100.0 /100 | #16 | Exceptional 96.5% |
| Dutch | 100.0 /100 | #17 | Exceptional 96.5% |
| Scandinavians | 100.0 /100 | #18 | Exceptional 96.5% |
| Welsh | 100.0 /100 | #19 | Exceptional 96.4% |
| Italians | 100.0 /100 | #20 | Exceptional 96.4% |
| Alaskan Athabascans | 100.0 /100 | #21 | Exceptional 96.4% |
| Europeans | 100.0 /100 | #22 | Exceptional 96.4% |
| Czechs | 100.0 /100 | #23 | Exceptional 96.4% |
| Latvians | 100.0 /100 | #24 | Exceptional 96.4% |
| French | 100.0 /100 | #25 | Exceptional 96.3% |
| French Canadians | 100.0 /100 | #26 | Exceptional 96.3% |
Demographics Similar to Immigrants from Pakistan by 9th Grade
In terms of 9th grade, the demographic groups most similar to Immigrants from Pakistan are Immigrants from Morocco (94.6%, a difference of 0.010%), Comanche (94.6%, a difference of 0.010%), Samoan (94.6%, a difference of 0.020%), Immigrants from Sudan (94.6%, a difference of 0.030%), and Immigrants from Chile (94.5%, a difference of 0.030%).
| Demographics | Rating | Rank | 9th Grade |
| Blacks/African Americans | 20.5 /100 | #201 | Fair 94.6% |
| Immigrants | Eastern Asia | 19.8 /100 | #202 | Poor 94.6% |
| Immigrants | Bahamas | 19.8 /100 | #203 | Poor 94.6% |
| Moroccans | 19.6 /100 | #204 | Poor 94.6% |
| Immigrants | Sudan | 17.6 /100 | #205 | Poor 94.6% |
| Samoans | 17.3 /100 | #206 | Poor 94.6% |
| Immigrants | Morocco | 16.3 /100 | #207 | Poor 94.6% |
| Immigrants | Pakistan | 15.5 /100 | #208 | Poor 94.6% |
| Comanche | 14.9 /100 | #209 | Poor 94.6% |
| Immigrants | Chile | 13.4 /100 | #210 | Poor 94.5% |
| Immigrants | Indonesia | 12.3 /100 | #211 | Poor 94.5% |
| Immigrants | Malaysia | 12.2 /100 | #212 | Poor 94.5% |
| Immigrants | Oceania | 12.1 /100 | #213 | Poor 94.5% |
| Immigrants | Liberia | 11.8 /100 | #214 | Poor 94.5% |
| Immigrants | Syria | 11.0 /100 | #215 | Poor 94.5% |