Welsh vs Immigrants from Greece 9th Grade
COMPARE
Welsh
Immigrants from Greece
9th Grade
9th Grade Comparison
Welsh
Immigrants from Greece
96.4%
9TH GRADE
100.0/ 100
METRIC RATING
19th/ 347
METRIC RANK
95.2%
9TH GRADE
84.6/ 100
METRIC RATING
142nd/ 347
METRIC RANK
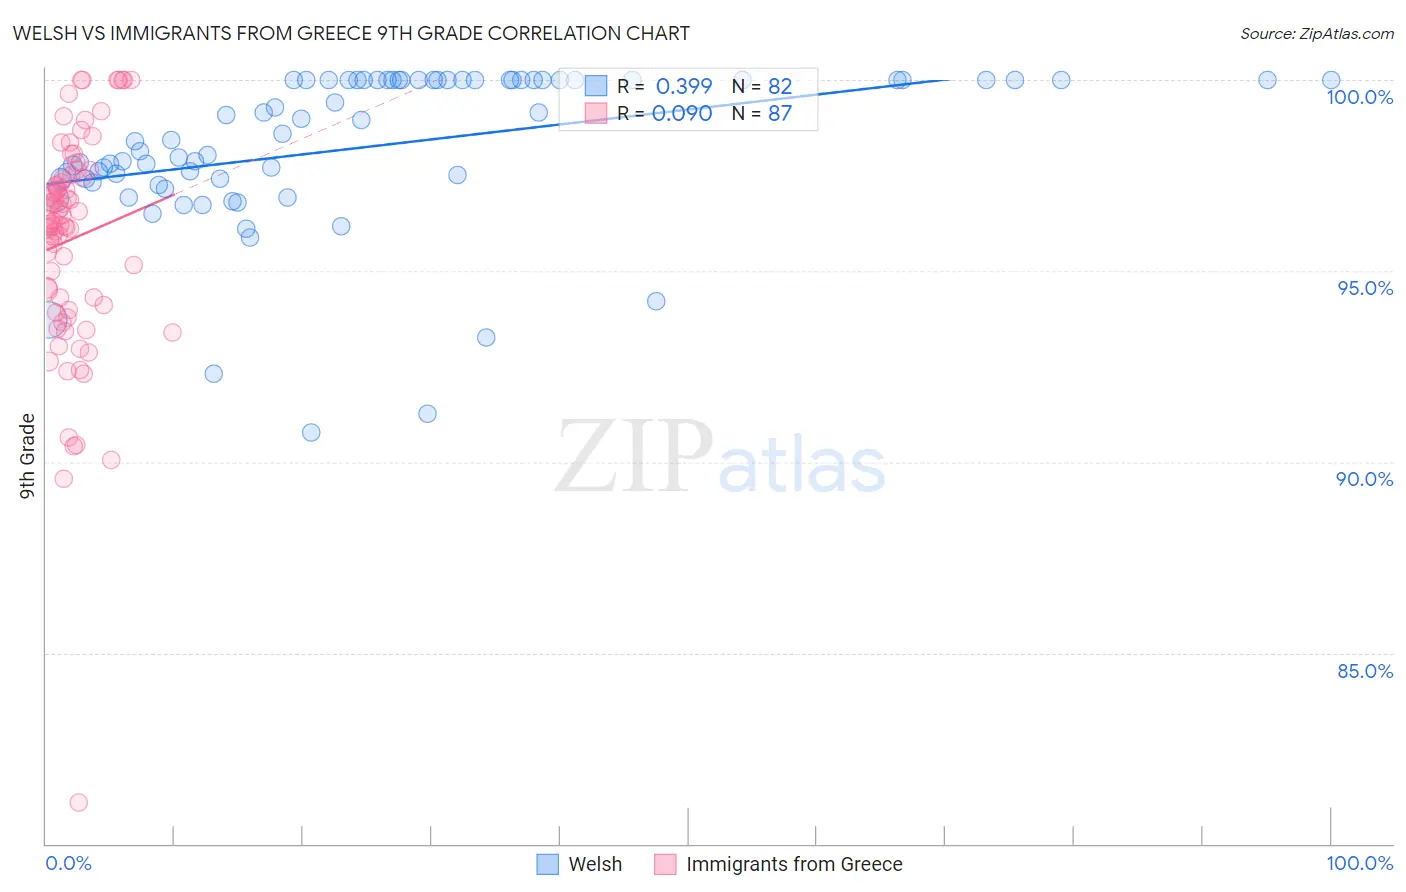
Welsh vs Immigrants from Greece 9th Grade Correlation Chart
The statistical analysis conducted on geographies consisting of 528,596,253 people shows a mild positive correlation between the proportion of Welsh and percentage of population with at least 9th grade education in the United States with a correlation coefficient (R) of 0.399 and weighted average of 96.4%. Similarly, the statistical analysis conducted on geographies consisting of 216,879,847 people shows a slight positive correlation between the proportion of Immigrants from Greece and percentage of population with at least 9th grade education in the United States with a correlation coefficient (R) of 0.090 and weighted average of 95.2%, a difference of 1.3%.
9th Grade Correlation Summary
| Measurement | Welsh | Immigrants from Greece |
| Minimum | 90.8% | 81.1% |
| Maximum | 100.0% | 100.0% |
| Range | 9.2% | 18.9% |
| Mean | 98.2% | 95.8% |
| Median | 98.5% | 96.2% |
| Interquartile 25% (IQ1) | 97.4% | 94.1% |
| Interquartile 75% (IQ3) | 100.0% | 97.4% |
| Interquartile Range (IQR) | 2.6% | 3.3% |
| Standard Deviation (Sample) | 2.1% | 2.9% |
| Standard Deviation (Population) | 2.1% | 2.9% |
Similar Demographics by 9th Grade
Demographics Similar to Welsh by 9th Grade
In terms of 9th grade, the demographic groups most similar to Welsh are Italian (96.4%, a difference of 0.0%), Alaskan Athabascan (96.4%, a difference of 0.020%), European (96.4%, a difference of 0.030%), Scandinavian (96.5%, a difference of 0.040%), and Czech (96.4%, a difference of 0.040%).
| Demographics | Rating | Rank | 9th Grade |
| English | 100.0 /100 | #12 | Exceptional 96.6% |
| Danes | 100.0 /100 | #13 | Exceptional 96.5% |
| Scottish | 100.0 /100 | #14 | Exceptional 96.5% |
| Irish | 100.0 /100 | #15 | Exceptional 96.5% |
| Croatians | 100.0 /100 | #16 | Exceptional 96.5% |
| Dutch | 100.0 /100 | #17 | Exceptional 96.5% |
| Scandinavians | 100.0 /100 | #18 | Exceptional 96.5% |
| Welsh | 100.0 /100 | #19 | Exceptional 96.4% |
| Italians | 100.0 /100 | #20 | Exceptional 96.4% |
| Alaskan Athabascans | 100.0 /100 | #21 | Exceptional 96.4% |
| Europeans | 100.0 /100 | #22 | Exceptional 96.4% |
| Czechs | 100.0 /100 | #23 | Exceptional 96.4% |
| Latvians | 100.0 /100 | #24 | Exceptional 96.4% |
| French | 100.0 /100 | #25 | Exceptional 96.3% |
| French Canadians | 100.0 /100 | #26 | Exceptional 96.3% |
Demographics Similar to Immigrants from Greece by 9th Grade
In terms of 9th grade, the demographic groups most similar to Immigrants from Greece are Spanish (95.2%, a difference of 0.0%), Immigrants from Taiwan (95.2%, a difference of 0.010%), Immigrants from Bosnia and Herzegovina (95.2%, a difference of 0.010%), Immigrants from Eastern Europe (95.2%, a difference of 0.020%), and Yup'ik (95.2%, a difference of 0.020%).
| Demographics | Rating | Rank | 9th Grade |
| Immigrants | Belarus | 88.9 /100 | #135 | Excellent 95.2% |
| Immigrants | Iran | 88.3 /100 | #136 | Excellent 95.2% |
| Hmong | 87.7 /100 | #137 | Excellent 95.2% |
| Immigrants | Russia | 86.6 /100 | #138 | Excellent 95.2% |
| Immigrants | Eastern Europe | 85.8 /100 | #139 | Excellent 95.2% |
| Immigrants | Taiwan | 85.3 /100 | #140 | Excellent 95.2% |
| Immigrants | Bosnia and Herzegovina | 85.2 /100 | #141 | Excellent 95.2% |
| Immigrants | Greece | 84.6 /100 | #142 | Excellent 95.2% |
| Spanish | 84.4 /100 | #143 | Excellent 95.2% |
| Yup'ik | 83.3 /100 | #144 | Excellent 95.2% |
| Pueblo | 82.2 /100 | #145 | Excellent 95.1% |
| Immigrants | Sri Lanka | 82.1 /100 | #146 | Excellent 95.1% |
| Choctaw | 81.9 /100 | #147 | Excellent 95.1% |
| Immigrants | Jordan | 81.2 /100 | #148 | Excellent 95.1% |
| Immigrants | Korea | 79.6 /100 | #149 | Good 95.1% |