Spaniard vs Danish Associate's Degree
COMPARE
Spaniard
Danish
Associate's Degree
Associate's Degree Comparison
Spaniards
Danes
45.2%
ASSOCIATE'S DEGREE
20.4/ 100
METRIC RATING
202nd/ 347
METRIC RANK
47.4%
ASSOCIATE'S DEGREE
77.3/ 100
METRIC RATING
147th/ 347
METRIC RANK
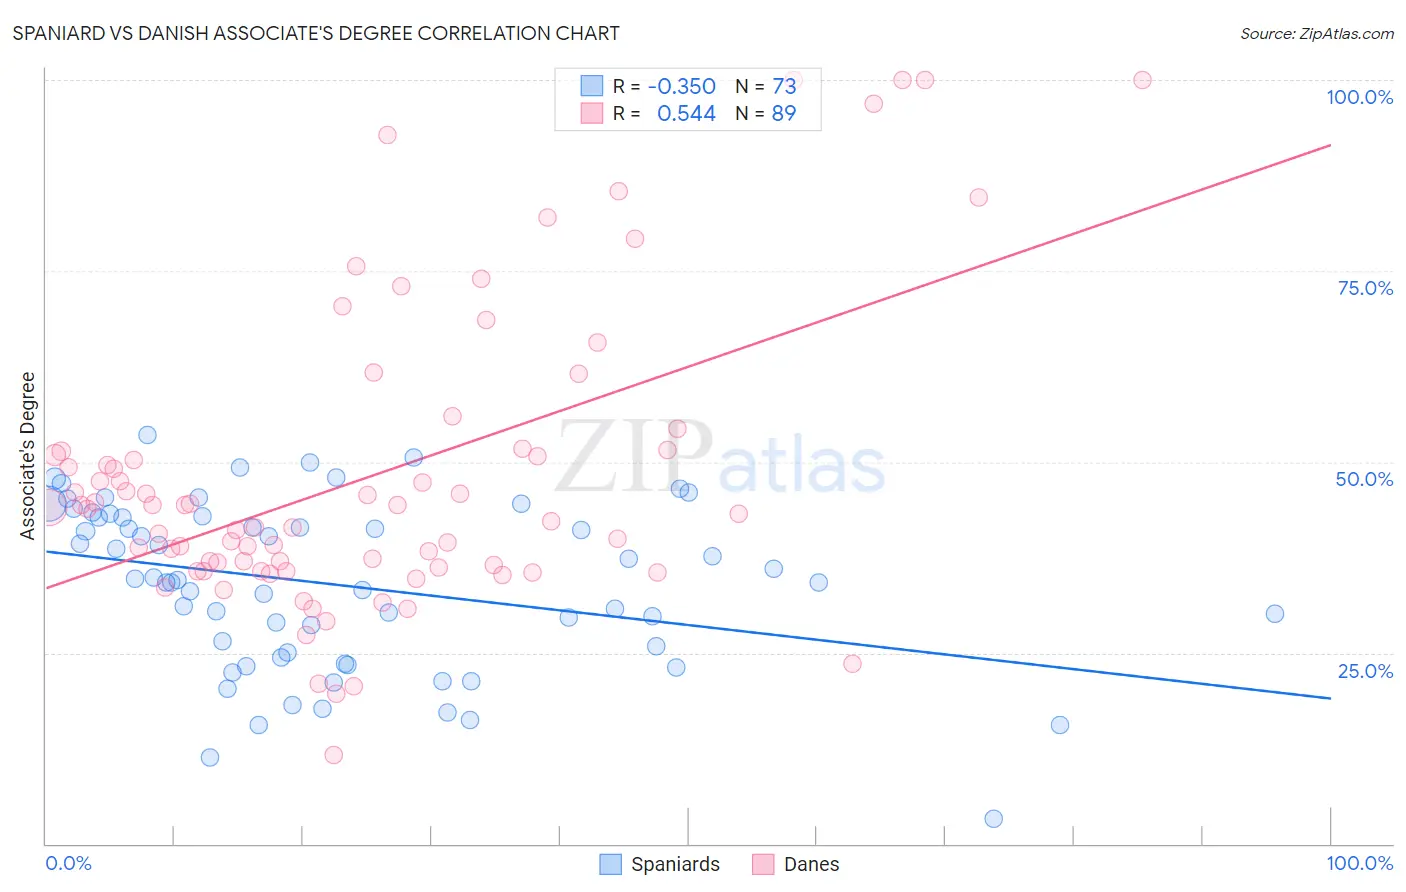
Spaniard vs Danish Associate's Degree Correlation Chart
The statistical analysis conducted on geographies consisting of 443,508,579 people shows a mild negative correlation between the proportion of Spaniards and percentage of population with at least associate's degree education in the United States with a correlation coefficient (R) of -0.350 and weighted average of 45.2%. Similarly, the statistical analysis conducted on geographies consisting of 474,170,437 people shows a substantial positive correlation between the proportion of Danes and percentage of population with at least associate's degree education in the United States with a correlation coefficient (R) of 0.544 and weighted average of 47.4%, a difference of 5.0%.
Associate's Degree Correlation Summary
| Measurement | Spaniard | Danish |
| Minimum | 3.3% | 11.7% |
| Maximum | 53.6% | 100.0% |
| Range | 50.2% | 88.3% |
| Mean | 33.8% | 48.1% |
| Median | 34.5% | 43.9% |
| Interquartile 25% (IQ1) | 24.7% | 36.0% |
| Interquartile 75% (IQ3) | 42.8% | 51.5% |
| Interquartile Range (IQR) | 18.1% | 15.5% |
| Standard Deviation (Sample) | 10.9% | 19.6% |
| Standard Deviation (Population) | 10.8% | 19.5% |
Similar Demographics by Associate's Degree
Demographics Similar to Spaniards by Associate's Degree
In terms of associate's degree, the demographic groups most similar to Spaniards are Immigrants from South Eastern Asia (45.2%, a difference of 0.020%), Immigrants from Vietnam (45.2%, a difference of 0.050%), Senegalese (45.2%, a difference of 0.080%), Immigrants from Senegal (45.2%, a difference of 0.090%), and Immigrants from Bangladesh (45.2%, a difference of 0.11%).
| Demographics | Rating | Rank | Associate's Degree |
| Germans | 26.5 /100 | #195 | Fair 45.5% |
| French | 25.6 /100 | #196 | Fair 45.4% |
| Scotch-Irish | 22.3 /100 | #197 | Fair 45.3% |
| Immigrants | Bangladesh | 21.3 /100 | #198 | Fair 45.2% |
| Immigrants | Senegal | 21.2 /100 | #199 | Fair 45.2% |
| Senegalese | 21.1 /100 | #200 | Fair 45.2% |
| Immigrants | Vietnam | 20.8 /100 | #201 | Fair 45.2% |
| Spaniards | 20.4 /100 | #202 | Fair 45.2% |
| Immigrants | South Eastern Asia | 20.2 /100 | #203 | Fair 45.2% |
| Nigerians | 19.1 /100 | #204 | Poor 45.1% |
| Immigrants | Thailand | 18.9 /100 | #205 | Poor 45.1% |
| German Russians | 18.9 /100 | #206 | Poor 45.1% |
| Panamanians | 18.4 /100 | #207 | Poor 45.1% |
| Dutch | 17.6 /100 | #208 | Poor 45.0% |
| Immigrants | Costa Rica | 16.7 /100 | #209 | Poor 45.0% |
Demographics Similar to Danes by Associate's Degree
In terms of associate's degree, the demographic groups most similar to Danes are Immigrants from Sudan (47.4%, a difference of 0.050%), South American Indian (47.4%, a difference of 0.060%), Immigrants from Armenia (47.4%, a difference of 0.070%), Iraqi (47.4%, a difference of 0.11%), and Immigrants from North Macedonia (47.4%, a difference of 0.14%).
| Demographics | Rating | Rank | Associate's Degree |
| Immigrants | Southern Europe | 84.4 /100 | #140 | Excellent 47.8% |
| Taiwanese | 83.3 /100 | #141 | Excellent 47.7% |
| Sierra Leoneans | 82.9 /100 | #142 | Excellent 47.7% |
| Norwegians | 81.0 /100 | #143 | Excellent 47.6% |
| Slavs | 80.5 /100 | #144 | Excellent 47.6% |
| Canadians | 79.0 /100 | #145 | Good 47.5% |
| Immigrants | Sudan | 77.9 /100 | #146 | Good 47.4% |
| Danes | 77.3 /100 | #147 | Good 47.4% |
| South American Indians | 76.7 /100 | #148 | Good 47.4% |
| Immigrants | Armenia | 76.6 /100 | #149 | Good 47.4% |
| Iraqis | 76.2 /100 | #150 | Good 47.4% |
| Immigrants | North Macedonia | 76.0 /100 | #151 | Good 47.4% |
| Immigrants | Afghanistan | 74.3 /100 | #152 | Good 47.3% |
| Czechs | 72.2 /100 | #153 | Good 47.2% |
| Immigrants | Kenya | 72.1 /100 | #154 | Good 47.2% |