Welsh vs Lebanese High School Diploma
COMPARE
Welsh
Lebanese
High School Diploma
High School Diploma Comparison
Welsh
Lebanese
91.2%
HIGH SCHOOL DIPLOMA
99.8/ 100
METRIC RATING
50th/ 347
METRIC RANK
90.4%
HIGH SCHOOL DIPLOMA
97.4/ 100
METRIC RATING
105th/ 347
METRIC RANK
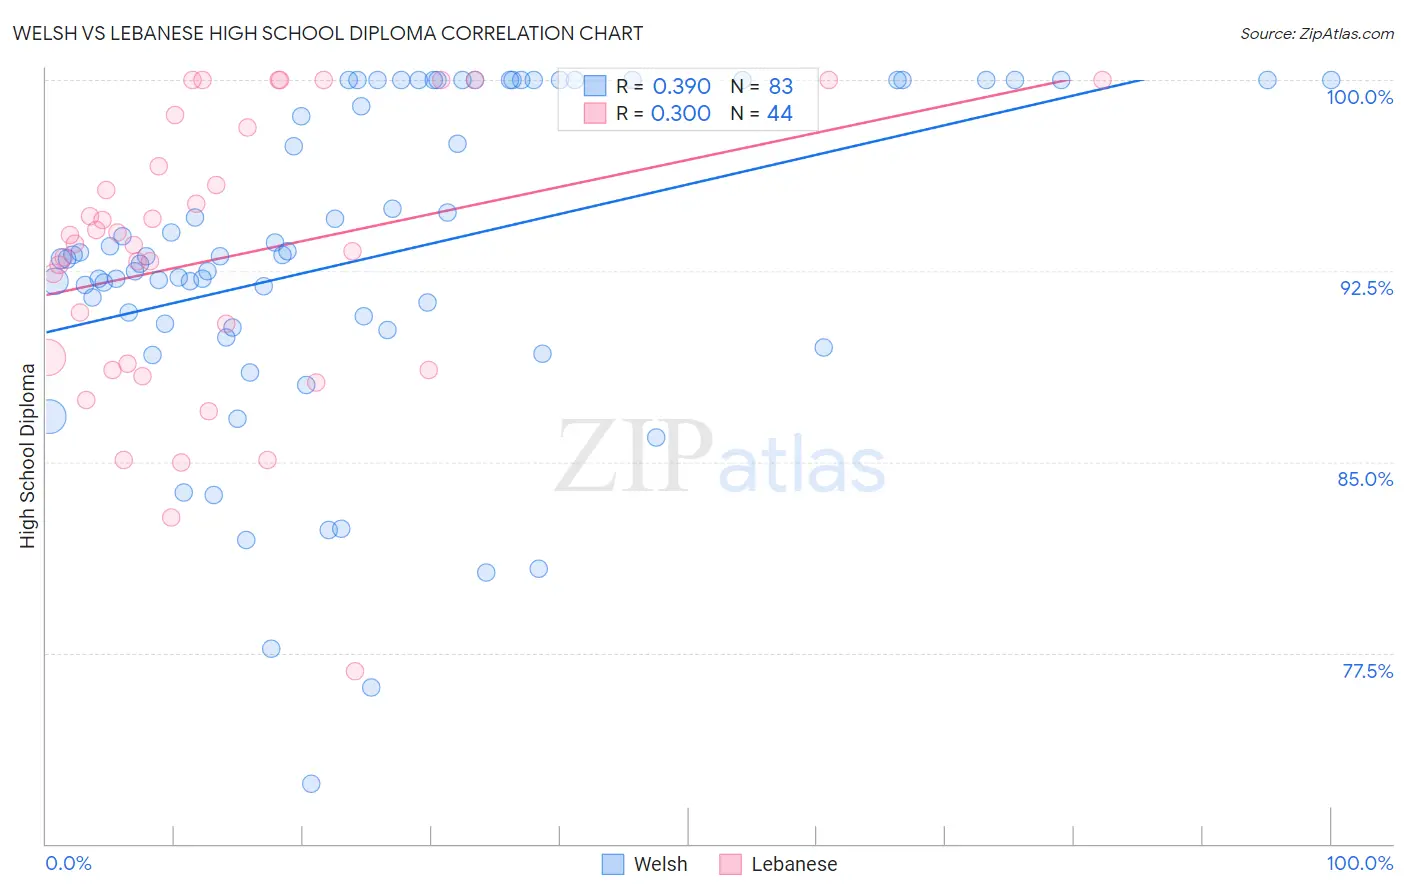
Welsh vs Lebanese High School Diploma Correlation Chart
The statistical analysis conducted on geographies consisting of 528,596,196 people shows a mild positive correlation between the proportion of Welsh and percentage of population with at least high school diploma education in the United States with a correlation coefficient (R) of 0.390 and weighted average of 91.2%. Similarly, the statistical analysis conducted on geographies consisting of 401,624,157 people shows a mild positive correlation between the proportion of Lebanese and percentage of population with at least high school diploma education in the United States with a correlation coefficient (R) of 0.300 and weighted average of 90.4%, a difference of 0.91%.
High School Diploma Correlation Summary
| Measurement | Welsh | Lebanese |
| Minimum | 72.4% | 76.8% |
| Maximum | 100.0% | 100.0% |
| Range | 27.6% | 23.2% |
| Mean | 93.0% | 93.0% |
| Median | 93.1% | 93.6% |
| Interquartile 25% (IQ1) | 90.3% | 88.7% |
| Interquartile 75% (IQ3) | 100.0% | 97.4% |
| Interquartile Range (IQR) | 9.7% | 8.6% |
| Standard Deviation (Sample) | 6.4% | 5.5% |
| Standard Deviation (Population) | 6.3% | 5.4% |
Similar Demographics by High School Diploma
Demographics Similar to Welsh by High School Diploma
In terms of high school diploma, the demographic groups most similar to Welsh are Bhutanese (91.2%, a difference of 0.020%), Australian (91.2%, a difference of 0.030%), Belgian (91.2%, a difference of 0.030%), Greek (91.2%, a difference of 0.040%), and New Zealander (91.1%, a difference of 0.050%).
| Demographics | Rating | Rank | High School Diploma |
| British | 99.8 /100 | #43 | Exceptional 91.3% |
| Immigrants | Austria | 99.8 /100 | #44 | Exceptional 91.3% |
| Turks | 99.8 /100 | #45 | Exceptional 91.2% |
| Greeks | 99.8 /100 | #46 | Exceptional 91.2% |
| Australians | 99.8 /100 | #47 | Exceptional 91.2% |
| Belgians | 99.8 /100 | #48 | Exceptional 91.2% |
| Bhutanese | 99.8 /100 | #49 | Exceptional 91.2% |
| Welsh | 99.8 /100 | #50 | Exceptional 91.2% |
| New Zealanders | 99.7 /100 | #51 | Exceptional 91.1% |
| Immigrants | Sweden | 99.7 /100 | #52 | Exceptional 91.1% |
| Immigrants | Belgium | 99.7 /100 | #53 | Exceptional 91.1% |
| Macedonians | 99.7 /100 | #54 | Exceptional 91.1% |
| Serbians | 99.7 /100 | #55 | Exceptional 91.1% |
| Immigrants | Canada | 99.7 /100 | #56 | Exceptional 91.1% |
| Zimbabweans | 99.7 /100 | #57 | Exceptional 91.1% |
Demographics Similar to Lebanese by High School Diploma
In terms of high school diploma, the demographic groups most similar to Lebanese are Syrian (90.3%, a difference of 0.050%), Immigrants from Croatia (90.4%, a difference of 0.060%), Immigrants from Romania (90.4%, a difference of 0.070%), Immigrants from Russia (90.3%, a difference of 0.070%), and Palestinian (90.3%, a difference of 0.080%).
| Demographics | Rating | Rank | High School Diploma |
| Immigrants | Korea | 98.3 /100 | #98 | Exceptional 90.5% |
| Immigrants | Europe | 98.2 /100 | #99 | Exceptional 90.5% |
| Immigrants | North Macedonia | 98.1 /100 | #100 | Exceptional 90.5% |
| Immigrants | Norway | 98.0 /100 | #101 | Exceptional 90.5% |
| Aleuts | 98.0 /100 | #102 | Exceptional 90.4% |
| Immigrants | Romania | 97.8 /100 | #103 | Exceptional 90.4% |
| Immigrants | Croatia | 97.8 /100 | #104 | Exceptional 90.4% |
| Lebanese | 97.4 /100 | #105 | Exceptional 90.4% |
| Syrians | 97.0 /100 | #106 | Exceptional 90.3% |
| Immigrants | Russia | 96.9 /100 | #107 | Exceptional 90.3% |
| Palestinians | 96.7 /100 | #108 | Exceptional 90.3% |
| Immigrants | Zimbabwe | 96.7 /100 | #109 | Exceptional 90.3% |
| Immigrants | Greece | 96.6 /100 | #110 | Exceptional 90.3% |
| Menominee | 96.6 /100 | #111 | Exceptional 90.3% |
| Immigrants | Belarus | 96.4 /100 | #112 | Exceptional 90.2% |