Welsh vs Hmong High School Diploma
COMPARE
Welsh
Hmong
High School Diploma
High School Diploma Comparison
Welsh
Hmong
91.2%
HIGH SCHOOL DIPLOMA
99.8/ 100
METRIC RATING
50th/ 347
METRIC RANK
89.1%
HIGH SCHOOL DIPLOMA
50.0/ 100
METRIC RATING
174th/ 347
METRIC RANK
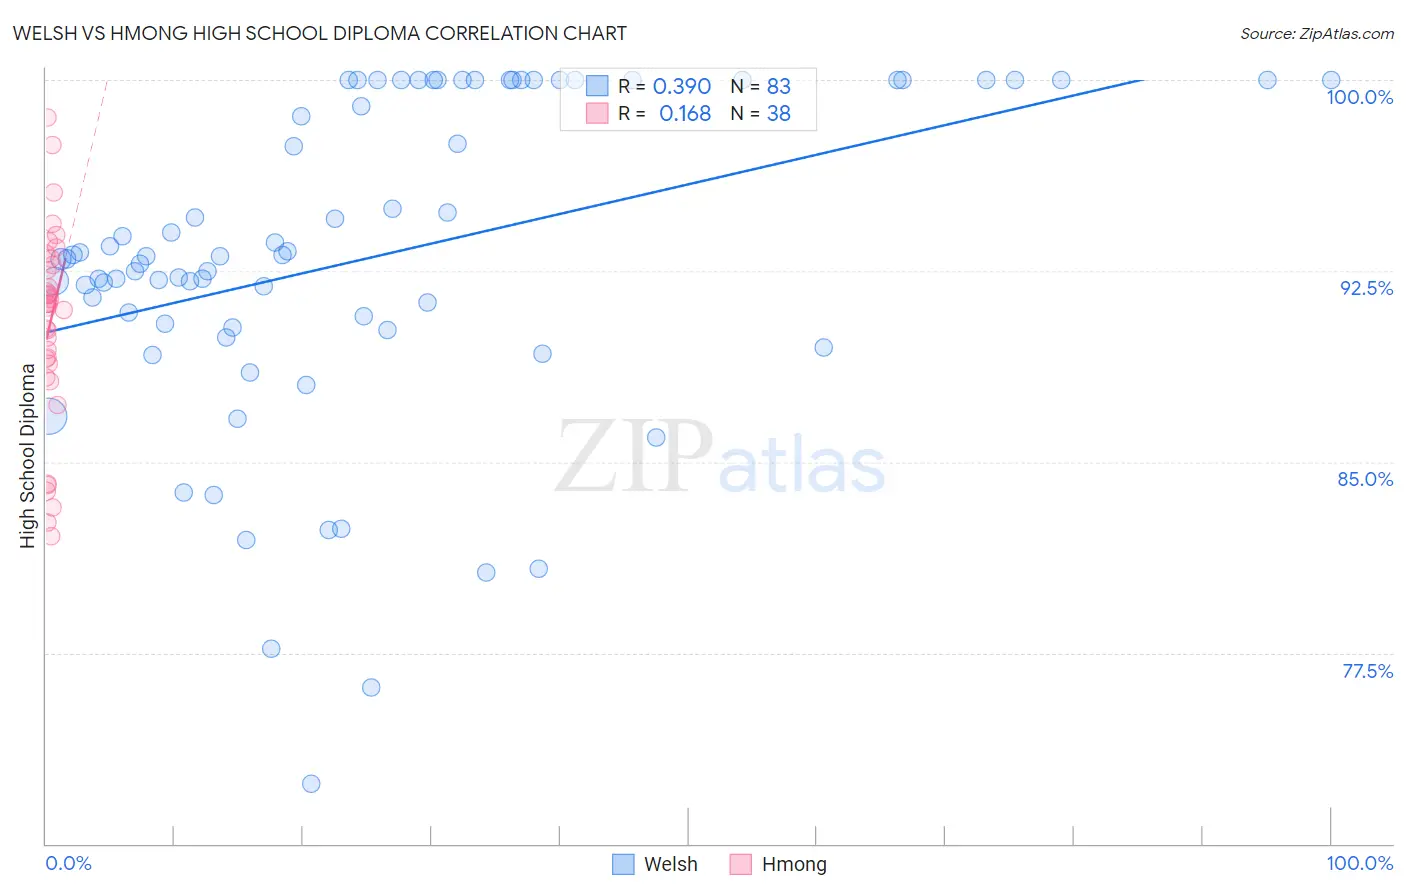
Welsh vs Hmong High School Diploma Correlation Chart
The statistical analysis conducted on geographies consisting of 528,596,196 people shows a mild positive correlation between the proportion of Welsh and percentage of population with at least high school diploma education in the United States with a correlation coefficient (R) of 0.390 and weighted average of 91.2%. Similarly, the statistical analysis conducted on geographies consisting of 24,672,093 people shows a poor positive correlation between the proportion of Hmong and percentage of population with at least high school diploma education in the United States with a correlation coefficient (R) of 0.168 and weighted average of 89.1%, a difference of 2.3%.
High School Diploma Correlation Summary
| Measurement | Welsh | Hmong |
| Minimum | 72.4% | 82.1% |
| Maximum | 100.0% | 98.5% |
| Range | 27.6% | 16.4% |
| Mean | 93.0% | 90.4% |
| Median | 93.1% | 91.2% |
| Interquartile 25% (IQ1) | 90.3% | 88.8% |
| Interquartile 75% (IQ3) | 100.0% | 92.7% |
| Interquartile Range (IQR) | 9.7% | 3.9% |
| Standard Deviation (Sample) | 6.4% | 3.9% |
| Standard Deviation (Population) | 6.3% | 3.8% |
Similar Demographics by High School Diploma
Demographics Similar to Welsh by High School Diploma
In terms of high school diploma, the demographic groups most similar to Welsh are Bhutanese (91.2%, a difference of 0.020%), Australian (91.2%, a difference of 0.030%), Belgian (91.2%, a difference of 0.030%), Greek (91.2%, a difference of 0.040%), and New Zealander (91.1%, a difference of 0.050%).
| Demographics | Rating | Rank | High School Diploma |
| British | 99.8 /100 | #43 | Exceptional 91.3% |
| Immigrants | Austria | 99.8 /100 | #44 | Exceptional 91.3% |
| Turks | 99.8 /100 | #45 | Exceptional 91.2% |
| Greeks | 99.8 /100 | #46 | Exceptional 91.2% |
| Australians | 99.8 /100 | #47 | Exceptional 91.2% |
| Belgians | 99.8 /100 | #48 | Exceptional 91.2% |
| Bhutanese | 99.8 /100 | #49 | Exceptional 91.2% |
| Welsh | 99.8 /100 | #50 | Exceptional 91.2% |
| New Zealanders | 99.7 /100 | #51 | Exceptional 91.1% |
| Immigrants | Sweden | 99.7 /100 | #52 | Exceptional 91.1% |
| Immigrants | Belgium | 99.7 /100 | #53 | Exceptional 91.1% |
| Macedonians | 99.7 /100 | #54 | Exceptional 91.1% |
| Serbians | 99.7 /100 | #55 | Exceptional 91.1% |
| Immigrants | Canada | 99.7 /100 | #56 | Exceptional 91.1% |
| Zimbabweans | 99.7 /100 | #57 | Exceptional 91.1% |
Demographics Similar to Hmong by High School Diploma
In terms of high school diploma, the demographic groups most similar to Hmong are Immigrants from Indonesia (89.1%, a difference of 0.0%), Immigrants from Western Asia (89.1%, a difference of 0.020%), Osage (89.1%, a difference of 0.020%), Sudanese (89.1%, a difference of 0.020%), and Sierra Leonean (89.1%, a difference of 0.020%).
| Demographics | Rating | Rank | High School Diploma |
| Immigrants | Hong Kong | 58.6 /100 | #167 | Average 89.3% |
| Delaware | 55.8 /100 | #168 | Average 89.2% |
| Iroquois | 55.1 /100 | #169 | Average 89.2% |
| Immigrants | Morocco | 53.3 /100 | #170 | Average 89.2% |
| Spanish | 52.9 /100 | #171 | Average 89.2% |
| Immigrants | Nonimmigrants | 51.8 /100 | #172 | Average 89.2% |
| Immigrants | Indonesia | 50.3 /100 | #173 | Average 89.1% |
| Hmong | 50.0 /100 | #174 | Average 89.1% |
| Immigrants | Western Asia | 49.0 /100 | #175 | Average 89.1% |
| Osage | 48.9 /100 | #176 | Average 89.1% |
| Sudanese | 48.5 /100 | #177 | Average 89.1% |
| Sierra Leoneans | 48.4 /100 | #178 | Average 89.1% |
| Americans | 47.2 /100 | #179 | Average 89.1% |
| Bolivians | 45.2 /100 | #180 | Average 89.1% |
| Venezuelans | 43.6 /100 | #181 | Average 89.1% |