Vietnamese vs Immigrants from Hong Kong 11th Grade
COMPARE
Vietnamese
Immigrants from Hong Kong
11th Grade
11th Grade Comparison
Vietnamese
Immigrants from Hong Kong
89.4%
11TH GRADE
0.0/ 100
METRIC RATING
311th/ 347
METRIC RANK
92.2%
11TH GRADE
23.3/ 100
METRIC RATING
204th/ 347
METRIC RANK
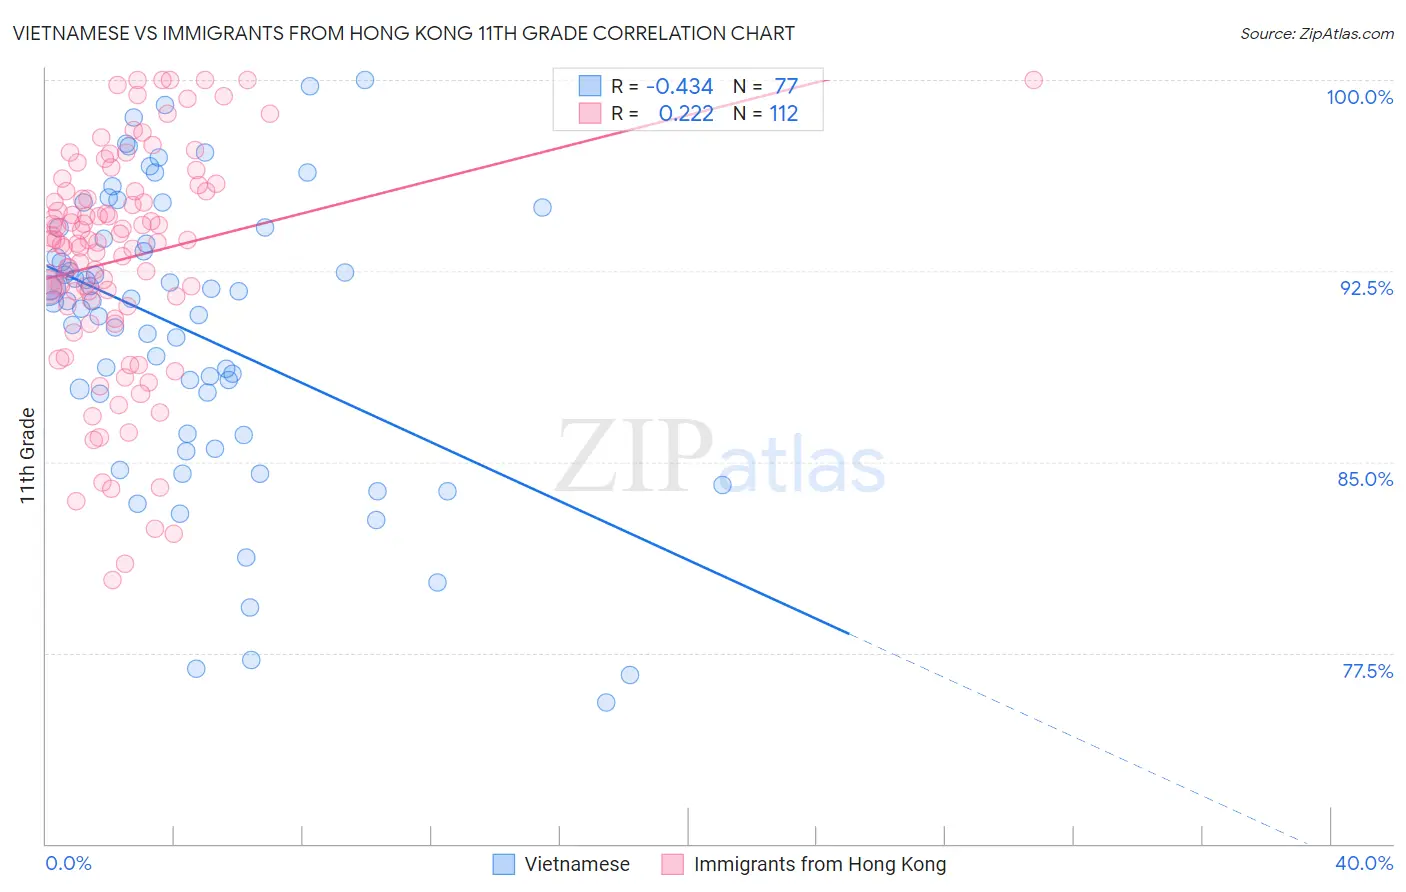
Vietnamese vs Immigrants from Hong Kong 11th Grade Correlation Chart
The statistical analysis conducted on geographies consisting of 170,728,240 people shows a moderate negative correlation between the proportion of Vietnamese and percentage of population with at least 11th grade education in the United States with a correlation coefficient (R) of -0.434 and weighted average of 89.4%. Similarly, the statistical analysis conducted on geographies consisting of 253,990,250 people shows a weak positive correlation between the proportion of Immigrants from Hong Kong and percentage of population with at least 11th grade education in the United States with a correlation coefficient (R) of 0.222 and weighted average of 92.2%, a difference of 3.2%.
11th Grade Correlation Summary
| Measurement | Vietnamese | Immigrants from Hong Kong |
| Minimum | 75.6% | 80.4% |
| Maximum | 100.0% | 100.0% |
| Range | 24.4% | 19.6% |
| Mean | 90.0% | 93.0% |
| Median | 91.3% | 93.7% |
| Interquartile 25% (IQ1) | 86.1% | 91.1% |
| Interquartile 75% (IQ3) | 94.0% | 95.6% |
| Interquartile Range (IQR) | 7.9% | 4.5% |
| Standard Deviation (Sample) | 5.7% | 4.5% |
| Standard Deviation (Population) | 5.7% | 4.4% |
Similar Demographics by 11th Grade
Demographics Similar to Vietnamese by 11th Grade
In terms of 11th grade, the demographic groups most similar to Vietnamese are Yaqui (89.5%, a difference of 0.060%), Immigrants from Bangladesh (89.5%, a difference of 0.080%), Nepalese (89.5%, a difference of 0.10%), Immigrants from Dominica (89.5%, a difference of 0.12%), and Ecuadorian (89.6%, a difference of 0.17%).
| Demographics | Rating | Rank | 11th Grade |
| Yuman | 0.0 /100 | #304 | Tragic 89.7% |
| Immigrants | Cambodia | 0.0 /100 | #305 | Tragic 89.6% |
| Ecuadorians | 0.0 /100 | #306 | Tragic 89.6% |
| Immigrants | Dominica | 0.0 /100 | #307 | Tragic 89.5% |
| Nepalese | 0.0 /100 | #308 | Tragic 89.5% |
| Immigrants | Bangladesh | 0.0 /100 | #309 | Tragic 89.5% |
| Yaqui | 0.0 /100 | #310 | Tragic 89.5% |
| Vietnamese | 0.0 /100 | #311 | Tragic 89.4% |
| Immigrants | Portugal | 0.0 /100 | #312 | Tragic 89.3% |
| Immigrants | Caribbean | 0.0 /100 | #313 | Tragic 89.1% |
| Cape Verdeans | 0.0 /100 | #314 | Tragic 89.1% |
| Immigrants | Ecuador | 0.0 /100 | #315 | Tragic 89.1% |
| Immigrants | Cuba | 0.0 /100 | #316 | Tragic 88.9% |
| Lumbee | 0.0 /100 | #317 | Tragic 88.9% |
| Nicaraguans | 0.0 /100 | #318 | Tragic 88.9% |
Demographics Similar to Immigrants from Hong Kong by 11th Grade
In terms of 11th grade, the demographic groups most similar to Immigrants from Hong Kong are Immigrants from Sudan (92.3%, a difference of 0.0%), Kiowa (92.2%, a difference of 0.0%), Bolivian (92.2%, a difference of 0.0%), Immigrants from Eastern Africa (92.3%, a difference of 0.010%), and Immigrants from Oceania (92.2%, a difference of 0.010%).
| Demographics | Rating | Rank | 11th Grade |
| Marshallese | 26.0 /100 | #197 | Fair 92.3% |
| Hawaiians | 25.5 /100 | #198 | Fair 92.3% |
| Immigrants | Uganda | 25.2 /100 | #199 | Fair 92.3% |
| Samoans | 25.1 /100 | #200 | Fair 92.3% |
| Immigrants | China | 25.1 /100 | #201 | Fair 92.3% |
| Immigrants | Eastern Africa | 24.1 /100 | #202 | Fair 92.3% |
| Immigrants | Sudan | 23.5 /100 | #203 | Fair 92.3% |
| Immigrants | Hong Kong | 23.3 /100 | #204 | Fair 92.2% |
| Kiowa | 23.2 /100 | #205 | Fair 92.2% |
| Bolivians | 23.2 /100 | #206 | Fair 92.2% |
| Immigrants | Oceania | 22.4 /100 | #207 | Fair 92.2% |
| Colville | 21.8 /100 | #208 | Fair 92.2% |
| Tongans | 19.8 /100 | #209 | Poor 92.2% |
| Ethiopians | 18.8 /100 | #210 | Poor 92.2% |
| Immigrants | Micronesia | 17.7 /100 | #211 | Poor 92.2% |