Vietnamese vs Creek 11th Grade
COMPARE
Vietnamese
Creek
11th Grade
11th Grade Comparison
Vietnamese
Creek
89.4%
11TH GRADE
0.0/ 100
METRIC RATING
311th/ 347
METRIC RANK
92.4%
11TH GRADE
40.9/ 100
METRIC RATING
179th/ 347
METRIC RANK
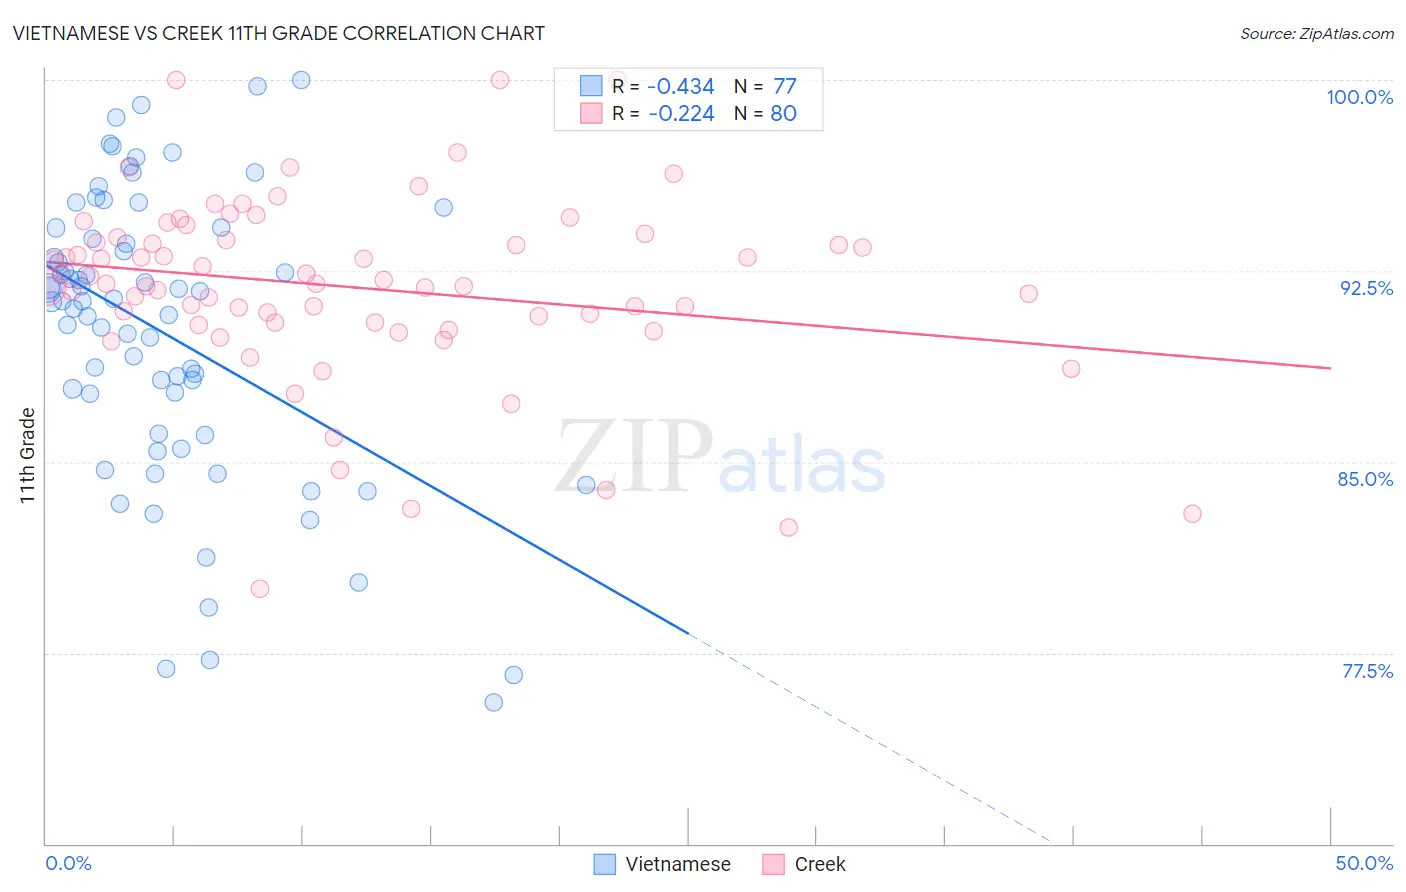
Vietnamese vs Creek 11th Grade Correlation Chart
The statistical analysis conducted on geographies consisting of 170,728,240 people shows a moderate negative correlation between the proportion of Vietnamese and percentage of population with at least 11th grade education in the United States with a correlation coefficient (R) of -0.434 and weighted average of 89.4%. Similarly, the statistical analysis conducted on geographies consisting of 178,480,629 people shows a weak negative correlation between the proportion of Creek and percentage of population with at least 11th grade education in the United States with a correlation coefficient (R) of -0.224 and weighted average of 92.4%, a difference of 3.4%.
11th Grade Correlation Summary
| Measurement | Vietnamese | Creek |
| Minimum | 75.6% | 80.0% |
| Maximum | 100.0% | 100.0% |
| Range | 24.4% | 20.0% |
| Mean | 90.0% | 91.9% |
| Median | 91.3% | 92.0% |
| Interquartile 25% (IQ1) | 86.1% | 90.5% |
| Interquartile 75% (IQ3) | 94.0% | 93.8% |
| Interquartile Range (IQR) | 7.9% | 3.3% |
| Standard Deviation (Sample) | 5.7% | 3.7% |
| Standard Deviation (Population) | 5.7% | 3.7% |
Similar Demographics by 11th Grade
Demographics Similar to Vietnamese by 11th Grade
In terms of 11th grade, the demographic groups most similar to Vietnamese are Yaqui (89.5%, a difference of 0.060%), Immigrants from Bangladesh (89.5%, a difference of 0.080%), Nepalese (89.5%, a difference of 0.10%), Immigrants from Dominica (89.5%, a difference of 0.12%), and Ecuadorian (89.6%, a difference of 0.17%).
| Demographics | Rating | Rank | 11th Grade |
| Yuman | 0.0 /100 | #304 | Tragic 89.7% |
| Immigrants | Cambodia | 0.0 /100 | #305 | Tragic 89.6% |
| Ecuadorians | 0.0 /100 | #306 | Tragic 89.6% |
| Immigrants | Dominica | 0.0 /100 | #307 | Tragic 89.5% |
| Nepalese | 0.0 /100 | #308 | Tragic 89.5% |
| Immigrants | Bangladesh | 0.0 /100 | #309 | Tragic 89.5% |
| Yaqui | 0.0 /100 | #310 | Tragic 89.5% |
| Vietnamese | 0.0 /100 | #311 | Tragic 89.4% |
| Immigrants | Portugal | 0.0 /100 | #312 | Tragic 89.3% |
| Immigrants | Caribbean | 0.0 /100 | #313 | Tragic 89.1% |
| Cape Verdeans | 0.0 /100 | #314 | Tragic 89.1% |
| Immigrants | Ecuador | 0.0 /100 | #315 | Tragic 89.1% |
| Immigrants | Cuba | 0.0 /100 | #316 | Tragic 88.9% |
| Lumbee | 0.0 /100 | #317 | Tragic 88.9% |
| Nicaraguans | 0.0 /100 | #318 | Tragic 88.9% |
Demographics Similar to Creek by 11th Grade
In terms of 11th grade, the demographic groups most similar to Creek are Inupiat (92.4%, a difference of 0.0%), Cherokee (92.4%, a difference of 0.0%), Sudanese (92.5%, a difference of 0.020%), Immigrants from Morocco (92.4%, a difference of 0.020%), and Immigrants from Malaysia (92.4%, a difference of 0.030%).
| Demographics | Rating | Rank | 11th Grade |
| Immigrants | Pakistan | 52.3 /100 | #172 | Average 92.5% |
| Indians (Asian) | 51.5 /100 | #173 | Average 92.5% |
| Asians | 50.0 /100 | #174 | Average 92.5% |
| Shoshone | 48.9 /100 | #175 | Average 92.5% |
| Spaniards | 46.9 /100 | #176 | Average 92.5% |
| Guamanians/Chamorros | 45.0 /100 | #177 | Average 92.5% |
| Sudanese | 43.4 /100 | #178 | Average 92.5% |
| Creek | 40.9 /100 | #179 | Average 92.4% |
| Inupiat | 40.7 /100 | #180 | Average 92.4% |
| Cherokee | 40.7 /100 | #181 | Average 92.4% |
| Immigrants | Morocco | 38.6 /100 | #182 | Fair 92.4% |
| Immigrants | Malaysia | 37.6 /100 | #183 | Fair 92.4% |
| Immigrants | Asia | 37.4 /100 | #184 | Fair 92.4% |
| Immigrants | Nepal | 36.4 /100 | #185 | Fair 92.4% |
| Arapaho | 35.1 /100 | #186 | Fair 92.4% |