Vietnamese vs Immigrants from Yemen 11th Grade
COMPARE
Vietnamese
Immigrants from Yemen
11th Grade
11th Grade Comparison
Vietnamese
Immigrants from Yemen
89.4%
11TH GRADE
0.0/ 100
METRIC RATING
311th/ 347
METRIC RANK
87.1%
11TH GRADE
0.0/ 100
METRIC RATING
333rd/ 347
METRIC RANK
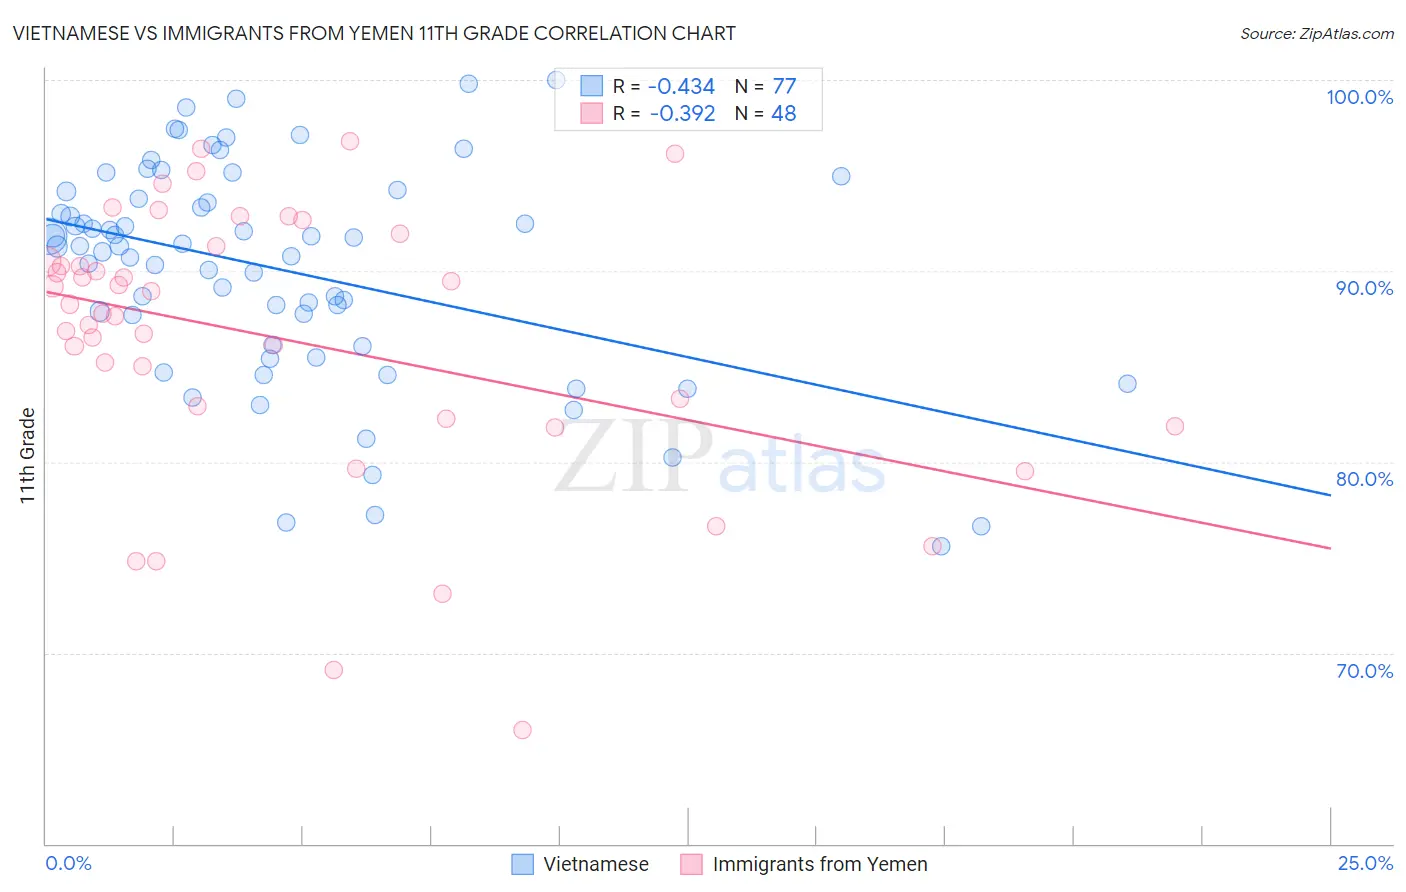
Vietnamese vs Immigrants from Yemen 11th Grade Correlation Chart
The statistical analysis conducted on geographies consisting of 170,728,240 people shows a moderate negative correlation between the proportion of Vietnamese and percentage of population with at least 11th grade education in the United States with a correlation coefficient (R) of -0.434 and weighted average of 89.4%. Similarly, the statistical analysis conducted on geographies consisting of 82,421,120 people shows a mild negative correlation between the proportion of Immigrants from Yemen and percentage of population with at least 11th grade education in the United States with a correlation coefficient (R) of -0.392 and weighted average of 87.1%, a difference of 2.7%.
11th Grade Correlation Summary
| Measurement | Vietnamese | Immigrants from Yemen |
| Minimum | 75.6% | 66.0% |
| Maximum | 100.0% | 96.8% |
| Range | 24.4% | 30.8% |
| Mean | 90.0% | 86.4% |
| Median | 91.3% | 88.0% |
| Interquartile 25% (IQ1) | 86.1% | 82.6% |
| Interquartile 75% (IQ3) | 94.0% | 90.9% |
| Interquartile Range (IQR) | 7.9% | 8.3% |
| Standard Deviation (Sample) | 5.7% | 7.2% |
| Standard Deviation (Population) | 5.7% | 7.1% |
Similar Demographics by 11th Grade
Demographics Similar to Vietnamese by 11th Grade
In terms of 11th grade, the demographic groups most similar to Vietnamese are Yaqui (89.5%, a difference of 0.060%), Immigrants from Bangladesh (89.5%, a difference of 0.080%), Nepalese (89.5%, a difference of 0.10%), Immigrants from Dominica (89.5%, a difference of 0.12%), and Ecuadorian (89.6%, a difference of 0.17%).
| Demographics | Rating | Rank | 11th Grade |
| Yuman | 0.0 /100 | #304 | Tragic 89.7% |
| Immigrants | Cambodia | 0.0 /100 | #305 | Tragic 89.6% |
| Ecuadorians | 0.0 /100 | #306 | Tragic 89.6% |
| Immigrants | Dominica | 0.0 /100 | #307 | Tragic 89.5% |
| Nepalese | 0.0 /100 | #308 | Tragic 89.5% |
| Immigrants | Bangladesh | 0.0 /100 | #309 | Tragic 89.5% |
| Yaqui | 0.0 /100 | #310 | Tragic 89.5% |
| Vietnamese | 0.0 /100 | #311 | Tragic 89.4% |
| Immigrants | Portugal | 0.0 /100 | #312 | Tragic 89.3% |
| Immigrants | Caribbean | 0.0 /100 | #313 | Tragic 89.1% |
| Cape Verdeans | 0.0 /100 | #314 | Tragic 89.1% |
| Immigrants | Ecuador | 0.0 /100 | #315 | Tragic 89.1% |
| Immigrants | Cuba | 0.0 /100 | #316 | Tragic 88.9% |
| Lumbee | 0.0 /100 | #317 | Tragic 88.9% |
| Nicaraguans | 0.0 /100 | #318 | Tragic 88.9% |
Demographics Similar to Immigrants from Yemen by 11th Grade
In terms of 11th grade, the demographic groups most similar to Immigrants from Yemen are Houma (87.0%, a difference of 0.060%), Central American (86.9%, a difference of 0.16%), Immigrants from the Azores (87.2%, a difference of 0.17%), Immigrants from Dominican Republic (86.9%, a difference of 0.20%), and Immigrants from Honduras (86.9%, a difference of 0.21%).
| Demographics | Rating | Rank | 11th Grade |
| Dominicans | 0.0 /100 | #326 | Tragic 87.7% |
| Immigrants | Cabo Verde | 0.0 /100 | #327 | Tragic 87.6% |
| Tohono O'odham | 0.0 /100 | #328 | Tragic 87.6% |
| Mexican American Indians | 0.0 /100 | #329 | Tragic 87.5% |
| Hondurans | 0.0 /100 | #330 | Tragic 87.4% |
| Hispanics or Latinos | 0.0 /100 | #331 | Tragic 87.3% |
| Immigrants | Azores | 0.0 /100 | #332 | Tragic 87.2% |
| Immigrants | Yemen | 0.0 /100 | #333 | Tragic 87.1% |
| Houma | 0.0 /100 | #334 | Tragic 87.0% |
| Central Americans | 0.0 /100 | #335 | Tragic 86.9% |
| Immigrants | Dominican Republic | 0.0 /100 | #336 | Tragic 86.9% |
| Immigrants | Honduras | 0.0 /100 | #337 | Tragic 86.9% |
| Immigrants | Latin America | 0.0 /100 | #338 | Tragic 86.8% |
| Guatemalans | 0.0 /100 | #339 | Tragic 86.4% |
| Salvadorans | 0.0 /100 | #340 | Tragic 86.2% |