Immigrants from Albania vs Slovak Professional Degree
COMPARE
Immigrants from Albania
Slovak
Professional Degree
Professional Degree Comparison
Immigrants from Albania
Slovaks
4.8%
PROFESSIONAL DEGREE
93.3/ 100
METRIC RATING
125th/ 347
METRIC RANK
4.3%
PROFESSIONAL DEGREE
30.7/ 100
METRIC RATING
189th/ 347
METRIC RANK
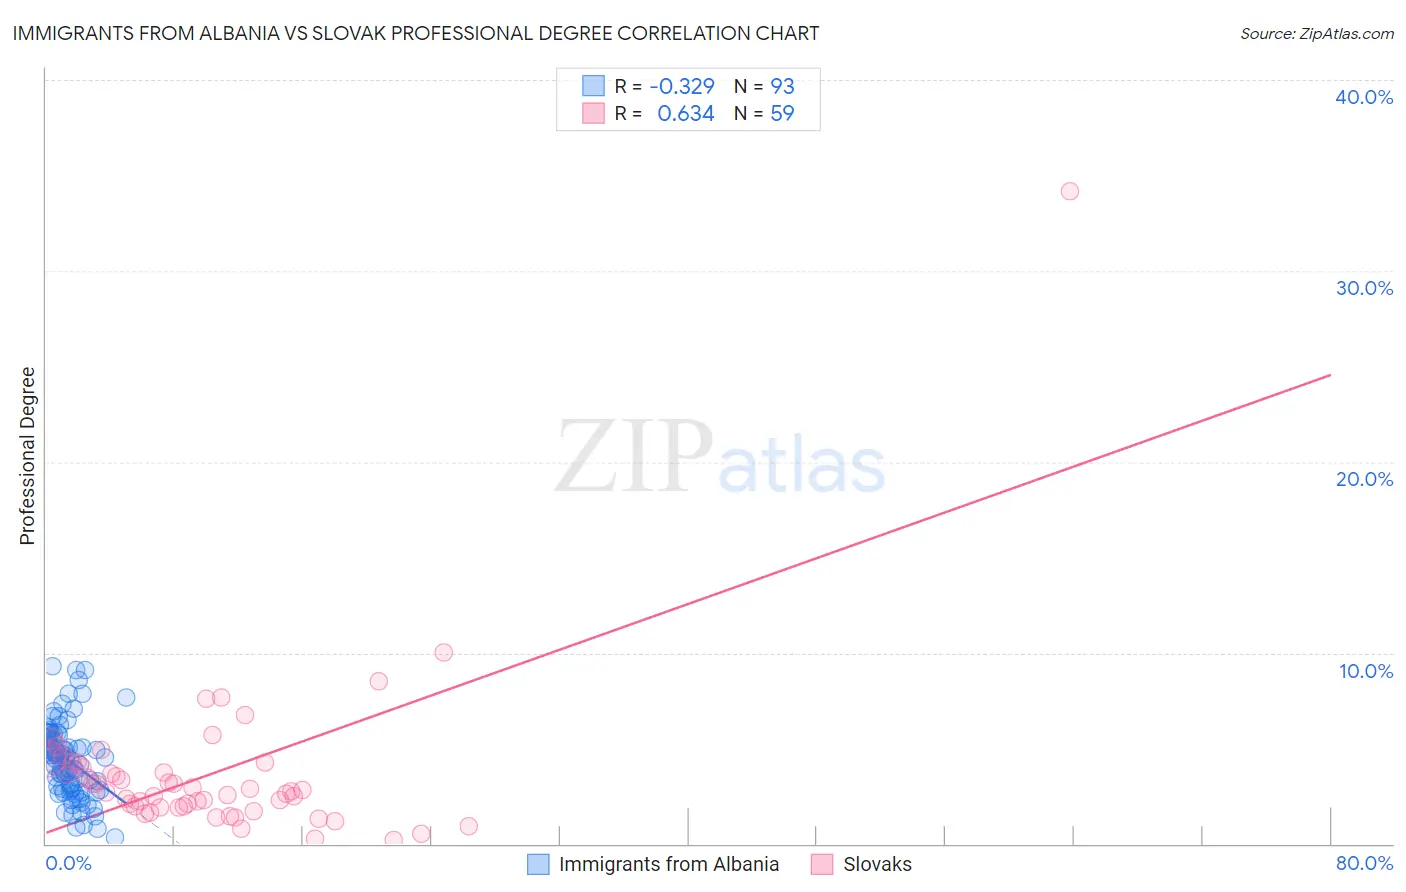
Immigrants from Albania vs Slovak Professional Degree Correlation Chart
The statistical analysis conducted on geographies consisting of 119,335,838 people shows a mild negative correlation between the proportion of Immigrants from Albania and percentage of population with at least professional degree education in the United States with a correlation coefficient (R) of -0.329 and weighted average of 4.8%. Similarly, the statistical analysis conducted on geographies consisting of 396,603,912 people shows a significant positive correlation between the proportion of Slovaks and percentage of population with at least professional degree education in the United States with a correlation coefficient (R) of 0.634 and weighted average of 4.3%, a difference of 12.9%.
Professional Degree Correlation Summary
| Measurement | Immigrants from Albania | Slovak |
| Minimum | 0.35% | 0.17% |
| Maximum | 9.3% | 34.2% |
| Range | 8.9% | 34.0% |
| Mean | 4.4% | 3.7% |
| Median | 4.4% | 2.8% |
| Interquartile 25% (IQ1) | 2.9% | 1.9% |
| Interquartile 75% (IQ3) | 5.6% | 4.2% |
| Interquartile Range (IQR) | 2.7% | 2.3% |
| Standard Deviation (Sample) | 2.0% | 4.5% |
| Standard Deviation (Population) | 1.9% | 4.5% |
Similar Demographics by Professional Degree
Demographics Similar to Immigrants from Albania by Professional Degree
In terms of professional degree, the demographic groups most similar to Immigrants from Albania are European (4.8%, a difference of 0.050%), Immigrants from Eritrea (4.8%, a difference of 0.12%), Immigrants from Venezuela (4.8%, a difference of 0.31%), Serbian (4.8%, a difference of 0.35%), and Immigrants from Eastern Africa (4.8%, a difference of 0.37%).
| Demographics | Rating | Rank | Professional Degree |
| Croatians | 96.0 /100 | #118 | Exceptional 4.9% |
| Immigrants | Sudan | 95.4 /100 | #119 | Exceptional 4.9% |
| Albanians | 95.3 /100 | #120 | Exceptional 4.9% |
| Immigrants | Moldova | 94.8 /100 | #121 | Exceptional 4.9% |
| Immigrants | Germany | 94.1 /100 | #122 | Exceptional 4.9% |
| Immigrants | Venezuela | 93.8 /100 | #123 | Exceptional 4.8% |
| Immigrants | Eritrea | 93.5 /100 | #124 | Exceptional 4.8% |
| Immigrants | Albania | 93.3 /100 | #125 | Exceptional 4.8% |
| Europeans | 93.2 /100 | #126 | Exceptional 4.8% |
| Serbians | 92.6 /100 | #127 | Exceptional 4.8% |
| Immigrants | Eastern Africa | 92.5 /100 | #128 | Exceptional 4.8% |
| Palestinians | 91.5 /100 | #129 | Exceptional 4.8% |
| Icelanders | 91.5 /100 | #130 | Exceptional 4.8% |
| Immigrants | Nepal | 91.4 /100 | #131 | Exceptional 4.8% |
| Pakistanis | 90.9 /100 | #132 | Exceptional 4.8% |
Demographics Similar to Slovaks by Professional Degree
In terms of professional degree, the demographic groups most similar to Slovaks are Immigrants from Thailand (4.3%, a difference of 0.17%), Immigrants from Poland (4.3%, a difference of 0.26%), Sri Lankan (4.3%, a difference of 0.30%), Immigrants from Cameroon (4.3%, a difference of 0.45%), and Scotch-Irish (4.3%, a difference of 0.60%).
| Demographics | Rating | Rank | Professional Degree |
| Immigrants | Immigrants | 43.2 /100 | #182 | Average 4.4% |
| Bermudans | 43.1 /100 | #183 | Average 4.4% |
| Belgians | 36.2 /100 | #184 | Fair 4.3% |
| Welsh | 35.8 /100 | #185 | Fair 4.3% |
| Scotch-Irish | 34.2 /100 | #186 | Fair 4.3% |
| Immigrants | Cameroon | 33.3 /100 | #187 | Fair 4.3% |
| Immigrants | Thailand | 31.7 /100 | #188 | Fair 4.3% |
| Slovaks | 30.7 /100 | #189 | Fair 4.3% |
| Immigrants | Poland | 29.2 /100 | #190 | Fair 4.3% |
| Sri Lankans | 29.0 /100 | #191 | Fair 4.3% |
| Ghanaians | 27.3 /100 | #192 | Fair 4.3% |
| French | 27.1 /100 | #193 | Fair 4.2% |
| Scandinavians | 25.8 /100 | #194 | Fair 4.2% |
| Nigerians | 24.6 /100 | #195 | Fair 4.2% |
| Spanish | 23.0 /100 | #196 | Fair 4.2% |