Sri Lankan vs Latvian Nursery School
COMPARE
Sri Lankan
Latvian
Nursery School
Nursery School Comparison
Sri Lankans
Latvians
97.0%
NURSERY SCHOOL
0.0/ 100
METRIC RATING
312th/ 347
METRIC RANK
98.5%
NURSERY SCHOOL
99.9/ 100
METRIC RATING
39th/ 347
METRIC RANK
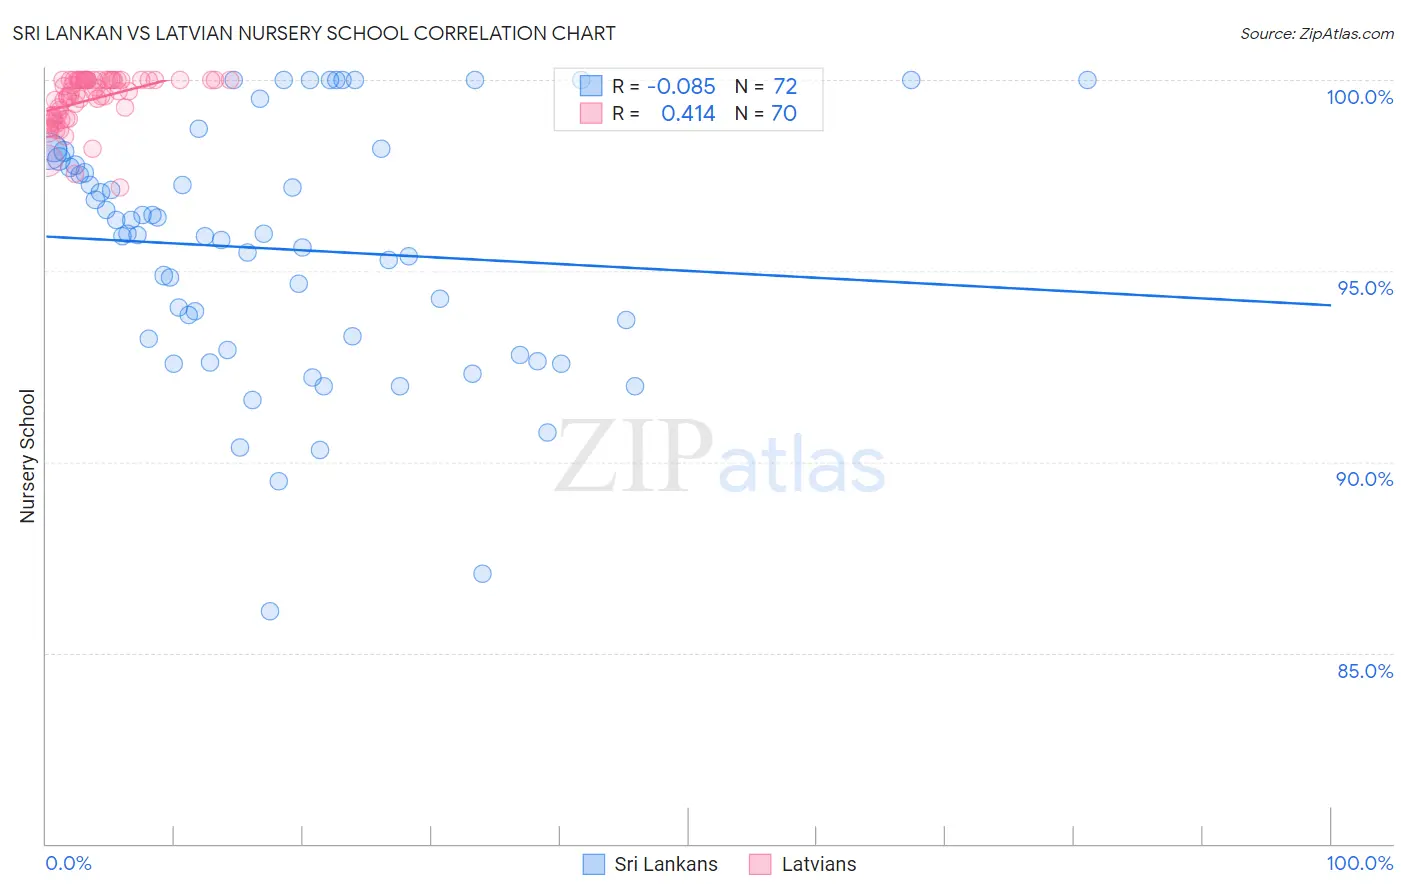
Sri Lankan vs Latvian Nursery School Correlation Chart
The statistical analysis conducted on geographies consisting of 440,593,746 people shows a slight negative correlation between the proportion of Sri Lankans and percentage of population with at least nursery school education in the United States with a correlation coefficient (R) of -0.085 and weighted average of 97.0%. Similarly, the statistical analysis conducted on geographies consisting of 220,726,452 people shows a moderate positive correlation between the proportion of Latvians and percentage of population with at least nursery school education in the United States with a correlation coefficient (R) of 0.414 and weighted average of 98.5%, a difference of 1.6%.
Nursery School Correlation Summary
| Measurement | Sri Lankan | Latvian |
| Minimum | 86.1% | 97.2% |
| Maximum | 100.0% | 100.0% |
| Range | 13.9% | 2.8% |
| Mean | 95.6% | 99.5% |
| Median | 96.0% | 99.7% |
| Interquartile 25% (IQ1) | 93.1% | 99.1% |
| Interquartile 75% (IQ3) | 97.8% | 100.0% |
| Interquartile Range (IQR) | 4.8% | 0.94% |
| Standard Deviation (Sample) | 3.2% | 0.64% |
| Standard Deviation (Population) | 3.2% | 0.64% |
Similar Demographics by Nursery School
Demographics Similar to Sri Lankans by Nursery School
In terms of nursery school, the demographic groups most similar to Sri Lankans are Guyanese (97.0%, a difference of 0.0%), Immigrants from the Azores (97.0%, a difference of 0.0%), Immigrants from Somalia (97.0%, a difference of 0.010%), Honduran (97.0%, a difference of 0.020%), and Hispanic or Latino (97.0%, a difference of 0.030%).
| Demographics | Rating | Rank | Nursery School |
| Somalis | 0.0 /100 | #305 | Tragic 97.1% |
| Belizeans | 0.0 /100 | #306 | Tragic 97.0% |
| Hispanics or Latinos | 0.0 /100 | #307 | Tragic 97.0% |
| Immigrants | Haiti | 0.0 /100 | #308 | Tragic 97.0% |
| Immigrants | Somalia | 0.0 /100 | #309 | Tragic 97.0% |
| Guyanese | 0.0 /100 | #310 | Tragic 97.0% |
| Immigrants | Azores | 0.0 /100 | #311 | Tragic 97.0% |
| Sri Lankans | 0.0 /100 | #312 | Tragic 97.0% |
| Hondurans | 0.0 /100 | #313 | Tragic 97.0% |
| Cape Verdeans | 0.0 /100 | #314 | Tragic 97.0% |
| Immigrants | Nicaragua | 0.0 /100 | #315 | Tragic 96.9% |
| Immigrants | Belize | 0.0 /100 | #316 | Tragic 96.9% |
| Immigrants | Ecuador | 0.0 /100 | #317 | Tragic 96.9% |
| Immigrants | Guyana | 0.0 /100 | #318 | Tragic 96.9% |
| Immigrants | Laos | 0.0 /100 | #319 | Tragic 96.9% |
Demographics Similar to Latvians by Nursery School
In terms of nursery school, the demographic groups most similar to Latvians are Italian (98.5%, a difference of 0.0%), Chippewa (98.5%, a difference of 0.0%), Lumbee (98.5%, a difference of 0.010%), Luxembourger (98.5%, a difference of 0.010%), and Eastern European (98.5%, a difference of 0.010%).
| Demographics | Rating | Rank | Nursery School |
| French Canadians | 100.0 /100 | #32 | Exceptional 98.6% |
| Scandinavians | 100.0 /100 | #33 | Exceptional 98.6% |
| Chinese | 100.0 /100 | #34 | Exceptional 98.6% |
| Swiss | 100.0 /100 | #35 | Exceptional 98.6% |
| British | 100.0 /100 | #36 | Exceptional 98.5% |
| Lumbee | 99.9 /100 | #37 | Exceptional 98.5% |
| Italians | 99.9 /100 | #38 | Exceptional 98.5% |
| Latvians | 99.9 /100 | #39 | Exceptional 98.5% |
| Chippewa | 99.9 /100 | #40 | Exceptional 98.5% |
| Luxembourgers | 99.9 /100 | #41 | Exceptional 98.5% |
| Eastern Europeans | 99.9 /100 | #42 | Exceptional 98.5% |
| Native Hawaiians | 99.9 /100 | #43 | Exceptional 98.5% |
| Belgians | 99.9 /100 | #44 | Exceptional 98.5% |
| Northern Europeans | 99.9 /100 | #45 | Exceptional 98.5% |
| Hungarians | 99.9 /100 | #46 | Exceptional 98.5% |