Vietnamese vs Immigrants from Turkey Nursery School
COMPARE
Vietnamese
Immigrants from Turkey
Nursery School
Nursery School Comparison
Vietnamese
Immigrants from Turkey
96.8%
NURSERY SCHOOL
0.0/ 100
METRIC RATING
324th/ 347
METRIC RANK
98.1%
NURSERY SCHOOL
83.0/ 100
METRIC RATING
141st/ 347
METRIC RANK
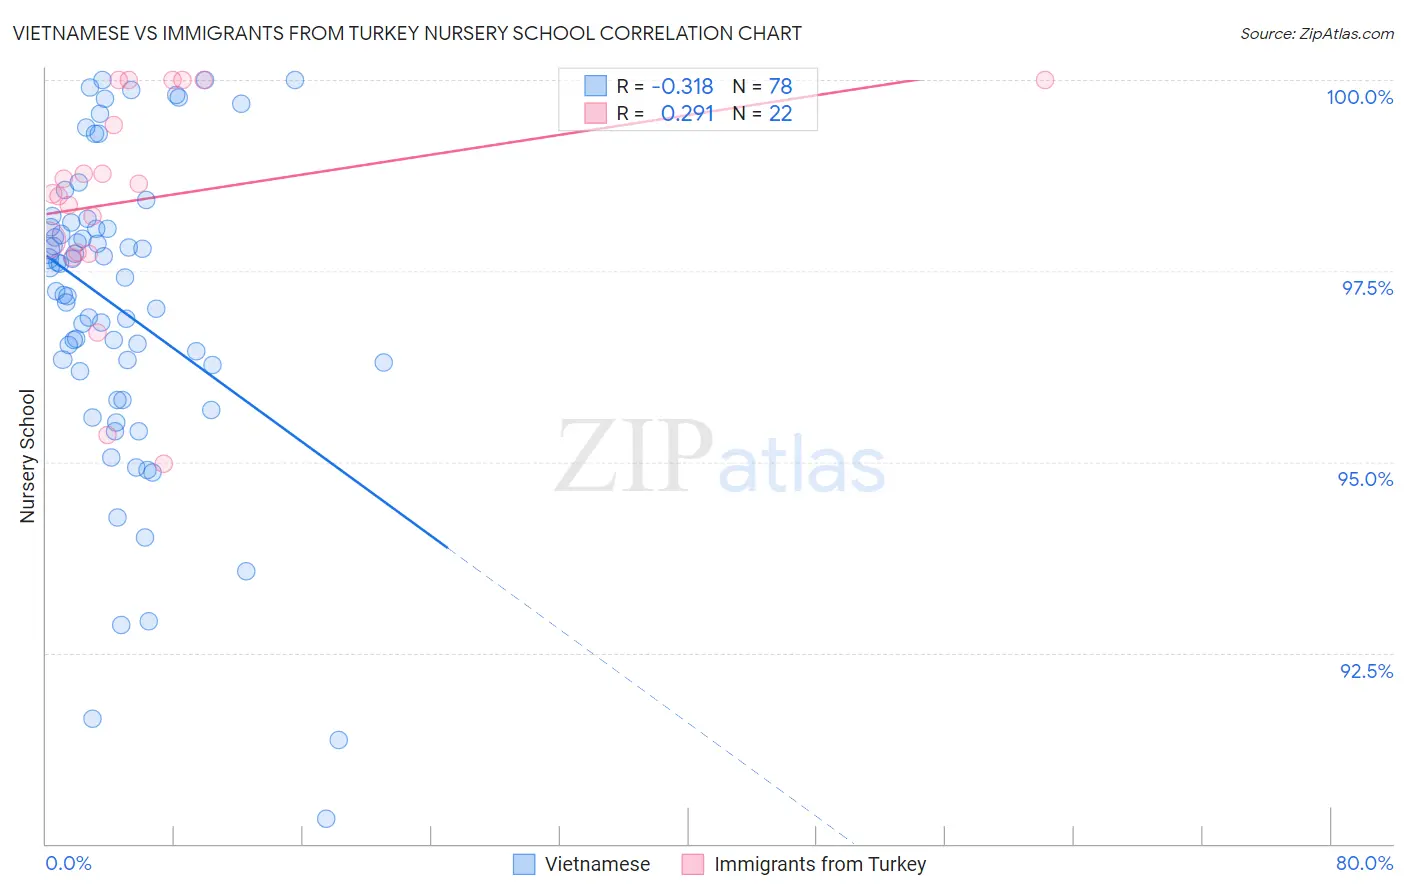
Vietnamese vs Immigrants from Turkey Nursery School Correlation Chart
The statistical analysis conducted on geographies consisting of 170,753,564 people shows a mild negative correlation between the proportion of Vietnamese and percentage of population with at least nursery school education in the United States with a correlation coefficient (R) of -0.318 and weighted average of 96.8%. Similarly, the statistical analysis conducted on geographies consisting of 223,057,877 people shows a weak positive correlation between the proportion of Immigrants from Turkey and percentage of population with at least nursery school education in the United States with a correlation coefficient (R) of 0.291 and weighted average of 98.1%, a difference of 1.3%.
Nursery School Correlation Summary
| Measurement | Vietnamese | Immigrants from Turkey |
| Minimum | 90.3% | 95.0% |
| Maximum | 100.0% | 100.0% |
| Range | 9.7% | 5.0% |
| Mean | 97.0% | 98.5% |
| Median | 97.3% | 98.6% |
| Interquartile 25% (IQ1) | 96.2% | 97.7% |
| Interquartile 75% (IQ3) | 98.1% | 100.0% |
| Interquartile Range (IQR) | 1.9% | 2.3% |
| Standard Deviation (Sample) | 2.0% | 1.4% |
| Standard Deviation (Population) | 2.0% | 1.4% |
Similar Demographics by Nursery School
Demographics Similar to Vietnamese by Nursery School
In terms of nursery school, the demographic groups most similar to Vietnamese are Immigrants from Honduras (96.9%, a difference of 0.010%), Mexican American Indian (96.9%, a difference of 0.020%), Immigrants from Bangladesh (96.9%, a difference of 0.030%), Dominican (96.8%, a difference of 0.030%), and Indonesian (96.8%, a difference of 0.030%).
| Demographics | Rating | Rank | Nursery School |
| Immigrants | Ecuador | 0.0 /100 | #317 | Tragic 96.9% |
| Immigrants | Guyana | 0.0 /100 | #318 | Tragic 96.9% |
| Immigrants | Laos | 0.0 /100 | #319 | Tragic 96.9% |
| Immigrants | Burma/Myanmar | 0.0 /100 | #320 | Tragic 96.9% |
| Immigrants | Bangladesh | 0.0 /100 | #321 | Tragic 96.9% |
| Mexican American Indians | 0.0 /100 | #322 | Tragic 96.9% |
| Immigrants | Honduras | 0.0 /100 | #323 | Tragic 96.9% |
| Vietnamese | 0.0 /100 | #324 | Tragic 96.8% |
| Dominicans | 0.0 /100 | #325 | Tragic 96.8% |
| Indonesians | 0.0 /100 | #326 | Tragic 96.8% |
| Mexicans | 0.0 /100 | #327 | Tragic 96.8% |
| Immigrants | Latin America | 0.0 /100 | #328 | Tragic 96.7% |
| Immigrants | Vietnam | 0.0 /100 | #329 | Tragic 96.7% |
| Japanese | 0.0 /100 | #330 | Tragic 96.7% |
| Immigrants | Armenia | 0.0 /100 | #331 | Tragic 96.7% |
Demographics Similar to Immigrants from Turkey by Nursery School
In terms of nursery school, the demographic groups most similar to Immigrants from Turkey are Palestinian (98.1%, a difference of 0.0%), Burmese (98.1%, a difference of 0.010%), Marshallese (98.1%, a difference of 0.010%), Alsatian (98.1%, a difference of 0.010%), and Immigrants from Israel (98.1%, a difference of 0.020%).
| Demographics | Rating | Rank | Nursery School |
| Immigrants | Bulgaria | 89.4 /100 | #134 | Excellent 98.1% |
| Immigrants | Hungary | 89.3 /100 | #135 | Excellent 98.1% |
| Immigrants | Kuwait | 88.9 /100 | #136 | Excellent 98.1% |
| Israelis | 88.2 /100 | #137 | Excellent 98.1% |
| Immigrants | Romania | 88.0 /100 | #138 | Excellent 98.1% |
| Blackfeet | 87.5 /100 | #139 | Excellent 98.1% |
| Palestinians | 83.7 /100 | #140 | Excellent 98.1% |
| Immigrants | Turkey | 83.0 /100 | #141 | Excellent 98.1% |
| Burmese | 81.7 /100 | #142 | Excellent 98.1% |
| Marshallese | 81.2 /100 | #143 | Excellent 98.1% |
| Alsatians | 80.3 /100 | #144 | Excellent 98.1% |
| Immigrants | Israel | 78.5 /100 | #145 | Good 98.1% |
| Filipinos | 78.5 /100 | #146 | Good 98.1% |
| Hmong | 75.7 /100 | #147 | Good 98.1% |
| Immigrants | Greece | 75.4 /100 | #148 | Good 98.1% |