Tohono O'odham vs Italian Doctorate Degree
COMPARE
Tohono O'odham
Italian
Doctorate Degree
Doctorate Degree Comparison
Tohono O'odham
Italians
1.5%
DOCTORATE DEGREE
0.4/ 100
METRIC RATING
281st/ 347
METRIC RANK
2.0%
DOCTORATE DEGREE
86.0/ 100
METRIC RATING
142nd/ 347
METRIC RANK
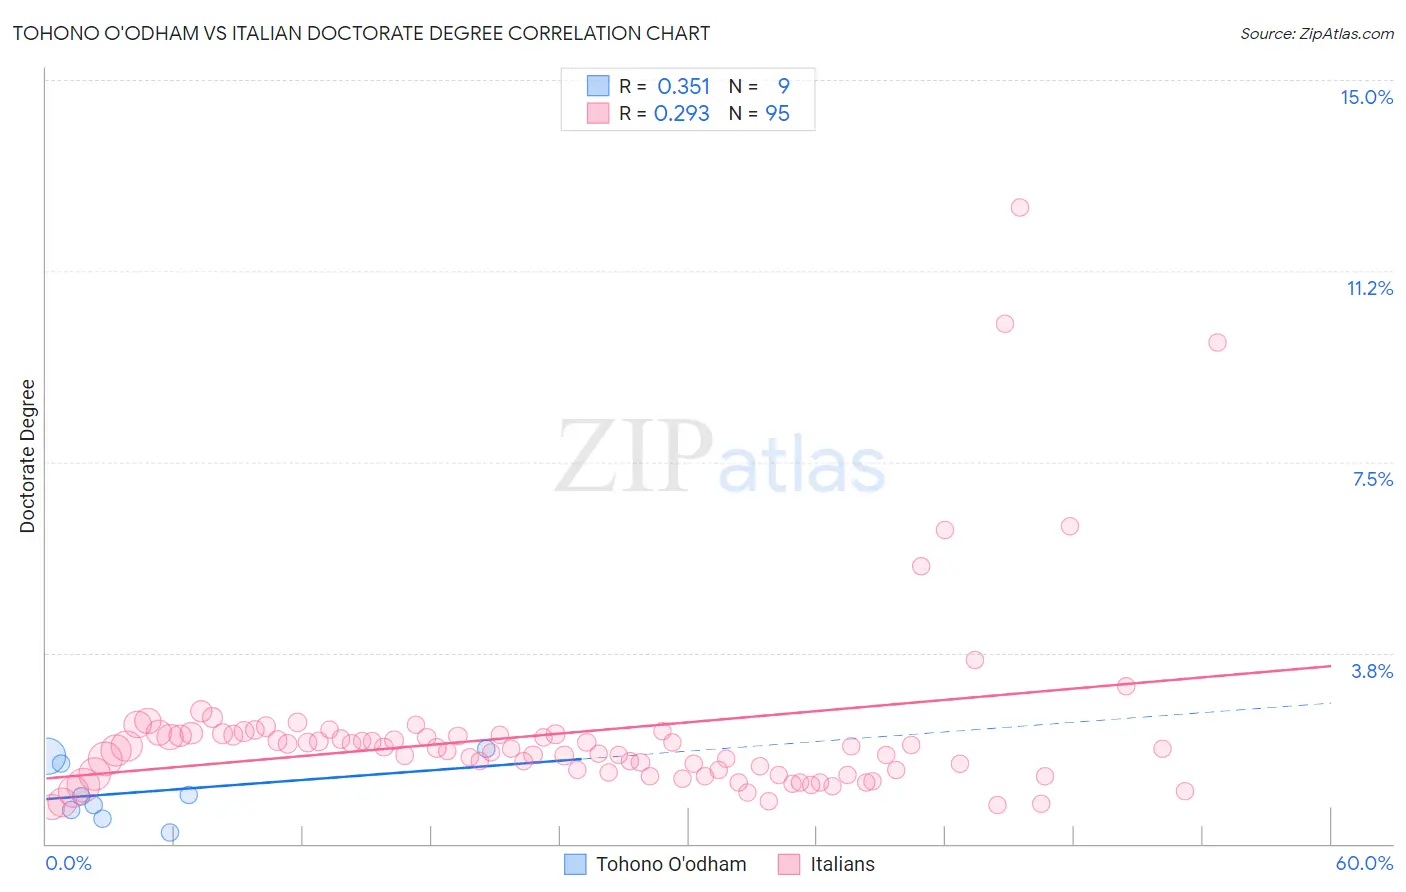
Tohono O'odham vs Italian Doctorate Degree Correlation Chart
The statistical analysis conducted on geographies consisting of 58,442,154 people shows a mild positive correlation between the proportion of Tohono O'odham and percentage of population with at least doctorate degree education in the United States with a correlation coefficient (R) of 0.351 and weighted average of 1.5%. Similarly, the statistical analysis conducted on geographies consisting of 549,362,939 people shows a weak positive correlation between the proportion of Italians and percentage of population with at least doctorate degree education in the United States with a correlation coefficient (R) of 0.293 and weighted average of 2.0%, a difference of 34.5%.
Doctorate Degree Correlation Summary
| Measurement | Tohono O'odham | Italian |
| Minimum | 0.23% | 0.72% |
| Maximum | 1.9% | 12.5% |
| Range | 1.6% | 11.8% |
| Mean | 1.0% | 2.2% |
| Median | 0.93% | 1.9% |
| Interquartile 25% (IQ1) | 0.58% | 1.4% |
| Interquartile 75% (IQ3) | 1.6% | 2.1% |
| Interquartile Range (IQR) | 1.1% | 0.77% |
| Standard Deviation (Sample) | 0.57% | 1.8% |
| Standard Deviation (Population) | 0.54% | 1.8% |
Similar Demographics by Doctorate Degree
Demographics Similar to Tohono O'odham by Doctorate Degree
In terms of doctorate degree, the demographic groups most similar to Tohono O'odham are British West Indian (1.5%, a difference of 0.050%), Ecuadorian (1.5%, a difference of 0.060%), Marshallese (1.5%, a difference of 0.080%), Central American (1.5%, a difference of 0.10%), and Jamaican (1.5%, a difference of 0.14%).
| Demographics | Rating | Rank | Doctorate Degree |
| Yaqui | 0.4 /100 | #274 | Tragic 1.5% |
| Aleuts | 0.4 /100 | #275 | Tragic 1.5% |
| Paiute | 0.4 /100 | #276 | Tragic 1.5% |
| Bahamians | 0.4 /100 | #277 | Tragic 1.5% |
| Hawaiians | 0.4 /100 | #278 | Tragic 1.5% |
| Marshallese | 0.4 /100 | #279 | Tragic 1.5% |
| Ecuadorians | 0.4 /100 | #280 | Tragic 1.5% |
| Tohono O'odham | 0.4 /100 | #281 | Tragic 1.5% |
| British West Indians | 0.3 /100 | #282 | Tragic 1.5% |
| Central Americans | 0.3 /100 | #283 | Tragic 1.5% |
| Jamaicans | 0.3 /100 | #284 | Tragic 1.5% |
| Malaysians | 0.3 /100 | #285 | Tragic 1.5% |
| Cherokee | 0.3 /100 | #286 | Tragic 1.5% |
| Cajuns | 0.3 /100 | #287 | Tragic 1.5% |
| Immigrants | El Salvador | 0.3 /100 | #288 | Tragic 1.4% |
Demographics Similar to Italians by Doctorate Degree
In terms of doctorate degree, the demographic groups most similar to Italians are Senegalese (2.0%, a difference of 0.21%), Sierra Leonean (2.0%, a difference of 0.25%), Immigrants from Africa (2.0%, a difference of 0.28%), Afghan (2.0%, a difference of 0.36%), and Immigrants from Moldova (2.0%, a difference of 0.46%).
| Demographics | Rating | Rank | Doctorate Degree |
| Serbians | 88.7 /100 | #135 | Excellent 2.0% |
| Swedes | 88.3 /100 | #136 | Excellent 2.0% |
| South American Indians | 88.3 /100 | #137 | Excellent 2.0% |
| Swiss | 88.0 /100 | #138 | Excellent 2.0% |
| Afghans | 87.2 /100 | #139 | Excellent 2.0% |
| Immigrants | Africa | 87.0 /100 | #140 | Excellent 2.0% |
| Senegalese | 86.7 /100 | #141 | Excellent 2.0% |
| Italians | 86.0 /100 | #142 | Excellent 2.0% |
| Sierra Leoneans | 85.1 /100 | #143 | Excellent 2.0% |
| Immigrants | Moldova | 84.3 /100 | #144 | Excellent 2.0% |
| Kenyans | 83.6 /100 | #145 | Excellent 1.9% |
| Immigrants | Syria | 83.6 /100 | #146 | Excellent 1.9% |
| Immigrants | Senegal | 82.5 /100 | #147 | Excellent 1.9% |
| Luxembourgers | 81.1 /100 | #148 | Excellent 1.9% |
| Basques | 76.9 /100 | #149 | Good 1.9% |