Immigrants from India vs Italian Doctorate Degree
COMPARE
Immigrants from India
Italian
Doctorate Degree
Doctorate Degree Comparison
Immigrants from India
Italians
2.8%
DOCTORATE DEGREE
100.0/ 100
METRIC RATING
15th/ 347
METRIC RANK
2.0%
DOCTORATE DEGREE
86.0/ 100
METRIC RATING
142nd/ 347
METRIC RANK
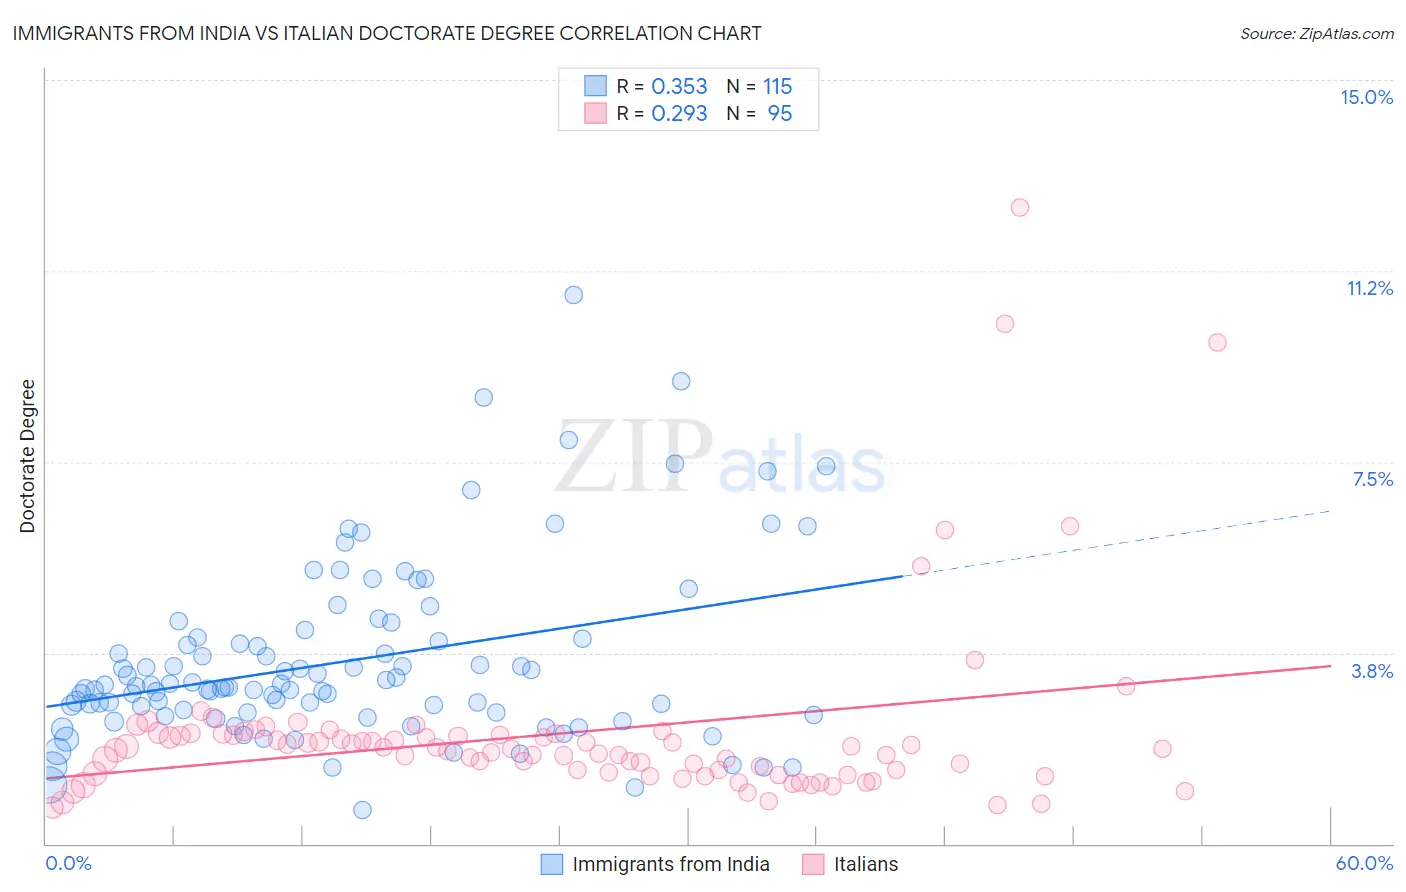
Immigrants from India vs Italian Doctorate Degree Correlation Chart
The statistical analysis conducted on geographies consisting of 430,386,279 people shows a mild positive correlation between the proportion of Immigrants from India and percentage of population with at least doctorate degree education in the United States with a correlation coefficient (R) of 0.353 and weighted average of 2.8%. Similarly, the statistical analysis conducted on geographies consisting of 549,362,939 people shows a weak positive correlation between the proportion of Italians and percentage of population with at least doctorate degree education in the United States with a correlation coefficient (R) of 0.293 and weighted average of 2.0%, a difference of 44.3%.
Doctorate Degree Correlation Summary
| Measurement | Immigrants from India | Italian |
| Minimum | 0.66% | 0.72% |
| Maximum | 10.8% | 12.5% |
| Range | 10.1% | 11.8% |
| Mean | 3.6% | 2.2% |
| Median | 3.1% | 1.9% |
| Interquartile 25% (IQ1) | 2.6% | 1.4% |
| Interquartile 75% (IQ3) | 4.0% | 2.1% |
| Interquartile Range (IQR) | 1.4% | 0.77% |
| Standard Deviation (Sample) | 1.7% | 1.8% |
| Standard Deviation (Population) | 1.7% | 1.8% |
Similar Demographics by Doctorate Degree
Demographics Similar to Immigrants from India by Doctorate Degree
In terms of doctorate degree, the demographic groups most similar to Immigrants from India are Eastern European (2.8%, a difference of 0.32%), Immigrants from Australia (2.8%, a difference of 1.0%), Immigrants from France (2.9%, a difference of 1.1%), Immigrants from Sweden (2.9%, a difference of 1.2%), and Immigrants from Sri Lanka (2.8%, a difference of 1.3%).
| Demographics | Rating | Rank | Doctorate Degree |
| Immigrants | Israel | 100.0 /100 | #8 | Exceptional 3.0% |
| Immigrants | Iran | 100.0 /100 | #9 | Exceptional 3.0% |
| Immigrants | Eastern Asia | 100.0 /100 | #10 | Exceptional 3.0% |
| Indians (Asian) | 100.0 /100 | #11 | Exceptional 2.9% |
| Immigrants | Belgium | 100.0 /100 | #12 | Exceptional 2.9% |
| Immigrants | Sweden | 100.0 /100 | #13 | Exceptional 2.9% |
| Immigrants | France | 100.0 /100 | #14 | Exceptional 2.9% |
| Immigrants | India | 100.0 /100 | #15 | Exceptional 2.8% |
| Eastern Europeans | 100.0 /100 | #16 | Exceptional 2.8% |
| Immigrants | Australia | 100.0 /100 | #17 | Exceptional 2.8% |
| Immigrants | Sri Lanka | 100.0 /100 | #18 | Exceptional 2.8% |
| Immigrants | Japan | 100.0 /100 | #19 | Exceptional 2.8% |
| Immigrants | Hong Kong | 100.0 /100 | #20 | Exceptional 2.8% |
| Thais | 100.0 /100 | #21 | Exceptional 2.8% |
| Mongolians | 100.0 /100 | #22 | Exceptional 2.8% |
Demographics Similar to Italians by Doctorate Degree
In terms of doctorate degree, the demographic groups most similar to Italians are Senegalese (2.0%, a difference of 0.21%), Sierra Leonean (2.0%, a difference of 0.25%), Immigrants from Africa (2.0%, a difference of 0.28%), Afghan (2.0%, a difference of 0.36%), and Immigrants from Moldova (2.0%, a difference of 0.46%).
| Demographics | Rating | Rank | Doctorate Degree |
| Serbians | 88.7 /100 | #135 | Excellent 2.0% |
| Swedes | 88.3 /100 | #136 | Excellent 2.0% |
| South American Indians | 88.3 /100 | #137 | Excellent 2.0% |
| Swiss | 88.0 /100 | #138 | Excellent 2.0% |
| Afghans | 87.2 /100 | #139 | Excellent 2.0% |
| Immigrants | Africa | 87.0 /100 | #140 | Excellent 2.0% |
| Senegalese | 86.7 /100 | #141 | Excellent 2.0% |
| Italians | 86.0 /100 | #142 | Excellent 2.0% |
| Sierra Leoneans | 85.1 /100 | #143 | Excellent 2.0% |
| Immigrants | Moldova | 84.3 /100 | #144 | Excellent 2.0% |
| Kenyans | 83.6 /100 | #145 | Excellent 1.9% |
| Immigrants | Syria | 83.6 /100 | #146 | Excellent 1.9% |
| Immigrants | Senegal | 82.5 /100 | #147 | Excellent 1.9% |
| Luxembourgers | 81.1 /100 | #148 | Excellent 1.9% |
| Basques | 76.9 /100 | #149 | Good 1.9% |