Vietnamese vs Immigrants from Egypt 9th Grade
COMPARE
Vietnamese
Immigrants from Egypt
9th Grade
9th Grade Comparison
Vietnamese
Immigrants from Egypt
92.3%
9TH GRADE
0.0/ 100
METRIC RATING
313th/ 347
METRIC RANK
94.9%
9TH GRADE
50.0/ 100
METRIC RATING
174th/ 347
METRIC RANK
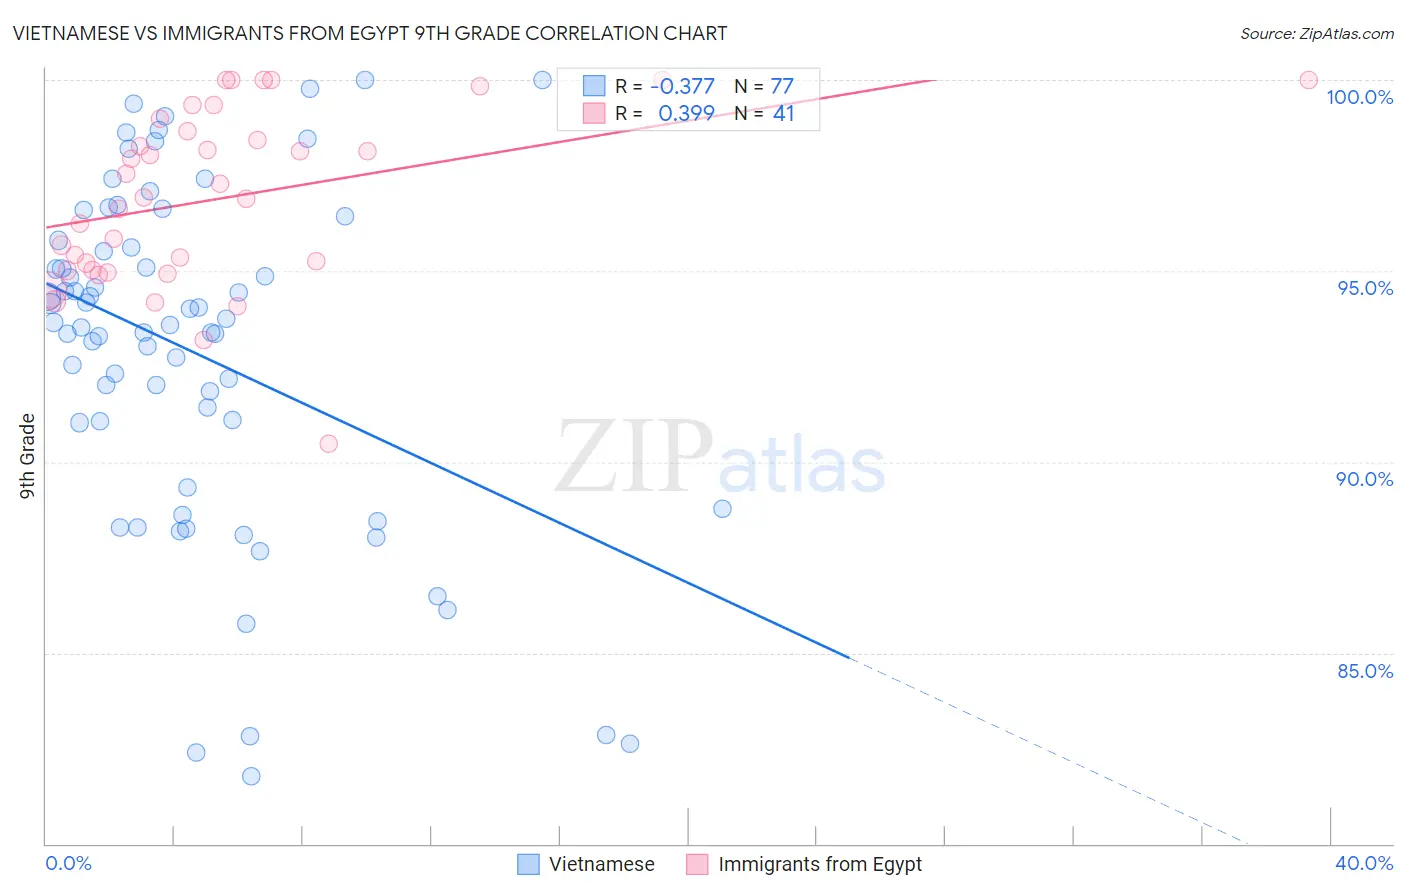
Vietnamese vs Immigrants from Egypt 9th Grade Correlation Chart
The statistical analysis conducted on geographies consisting of 170,728,240 people shows a mild negative correlation between the proportion of Vietnamese and percentage of population with at least 9th grade education in the United States with a correlation coefficient (R) of -0.377 and weighted average of 92.3%. Similarly, the statistical analysis conducted on geographies consisting of 245,485,794 people shows a mild positive correlation between the proportion of Immigrants from Egypt and percentage of population with at least 9th grade education in the United States with a correlation coefficient (R) of 0.399 and weighted average of 94.9%, a difference of 2.8%.
9th Grade Correlation Summary
| Measurement | Vietnamese | Immigrants from Egypt |
| Minimum | 81.8% | 90.5% |
| Maximum | 100.0% | 100.0% |
| Range | 18.2% | 9.5% |
| Mean | 92.9% | 96.9% |
| Median | 93.6% | 96.9% |
| Interquartile 25% (IQ1) | 90.2% | 95.0% |
| Interquartile 75% (IQ3) | 95.7% | 98.8% |
| Interquartile Range (IQR) | 5.5% | 3.8% |
| Standard Deviation (Sample) | 4.4% | 2.3% |
| Standard Deviation (Population) | 4.4% | 2.3% |
Similar Demographics by 9th Grade
Demographics Similar to Vietnamese by 9th Grade
In terms of 9th grade, the demographic groups most similar to Vietnamese are Houma (92.3%, a difference of 0.020%), Immigrants from Portugal (92.2%, a difference of 0.040%), Immigrants from Fiji (92.3%, a difference of 0.050%), Immigrants from Caribbean (92.2%, a difference of 0.050%), and Immigrants from Cambodia (92.4%, a difference of 0.080%).
| Demographics | Rating | Rank | 9th Grade |
| Immigrants | Vietnam | 0.0 /100 | #306 | Tragic 92.6% |
| Immigrants | Immigrants | 0.0 /100 | #307 | Tragic 92.5% |
| Immigrants | Guyana | 0.0 /100 | #308 | Tragic 92.5% |
| Immigrants | Bangladesh | 0.0 /100 | #309 | Tragic 92.4% |
| Immigrants | Cambodia | 0.0 /100 | #310 | Tragic 92.4% |
| Immigrants | Fiji | 0.0 /100 | #311 | Tragic 92.3% |
| Houma | 0.0 /100 | #312 | Tragic 92.3% |
| Vietnamese | 0.0 /100 | #313 | Tragic 92.3% |
| Immigrants | Portugal | 0.0 /100 | #314 | Tragic 92.2% |
| Immigrants | Caribbean | 0.0 /100 | #315 | Tragic 92.2% |
| Cape Verdeans | 0.0 /100 | #316 | Tragic 92.2% |
| Immigrants | Cuba | 0.0 /100 | #317 | Tragic 92.2% |
| Nepalese | 0.0 /100 | #318 | Tragic 92.0% |
| Ecuadorians | 0.0 /100 | #319 | Tragic 91.9% |
| Nicaraguans | 0.0 /100 | #320 | Tragic 91.9% |
Demographics Similar to Immigrants from Egypt by 9th Grade
In terms of 9th grade, the demographic groups most similar to Immigrants from Egypt are Brazilian (94.9%, a difference of 0.0%), Cheyenne (94.9%, a difference of 0.010%), Immigrants from Spain (94.9%, a difference of 0.010%), Immigrants from Iraq (94.9%, a difference of 0.020%), and Immigrants from Poland (94.9%, a difference of 0.020%).
| Demographics | Rating | Rank | 9th Grade |
| Immigrants | Brazil | 61.1 /100 | #167 | Good 95.0% |
| Chileans | 60.7 /100 | #168 | Good 95.0% |
| Spaniards | 59.6 /100 | #169 | Average 94.9% |
| Alsatians | 58.6 /100 | #170 | Average 94.9% |
| Colville | 58.5 /100 | #171 | Average 94.9% |
| Iraqis | 54.0 /100 | #172 | Average 94.9% |
| Cheyenne | 51.5 /100 | #173 | Average 94.9% |
| Immigrants | Egypt | 50.0 /100 | #174 | Average 94.9% |
| Brazilians | 49.8 /100 | #175 | Average 94.9% |
| Immigrants | Spain | 49.1 /100 | #176 | Average 94.9% |
| Immigrants | Iraq | 47.8 /100 | #177 | Average 94.9% |
| Immigrants | Poland | 46.7 /100 | #178 | Average 94.9% |
| Immigrants | Venezuela | 46.5 /100 | #179 | Average 94.9% |
| Immigrants | Uganda | 43.1 /100 | #180 | Average 94.8% |
| Sierra Leoneans | 42.7 /100 | #181 | Average 94.8% |