Vietnamese vs Filipino High School Diploma
COMPARE
Vietnamese
Filipino
High School Diploma
High School Diploma Comparison
Vietnamese
Filipinos
85.4%
HIGH SCHOOL DIPLOMA
0.0/ 100
METRIC RATING
301st/ 347
METRIC RANK
91.6%
HIGH SCHOOL DIPLOMA
99.9/ 100
METRIC RATING
21st/ 347
METRIC RANK
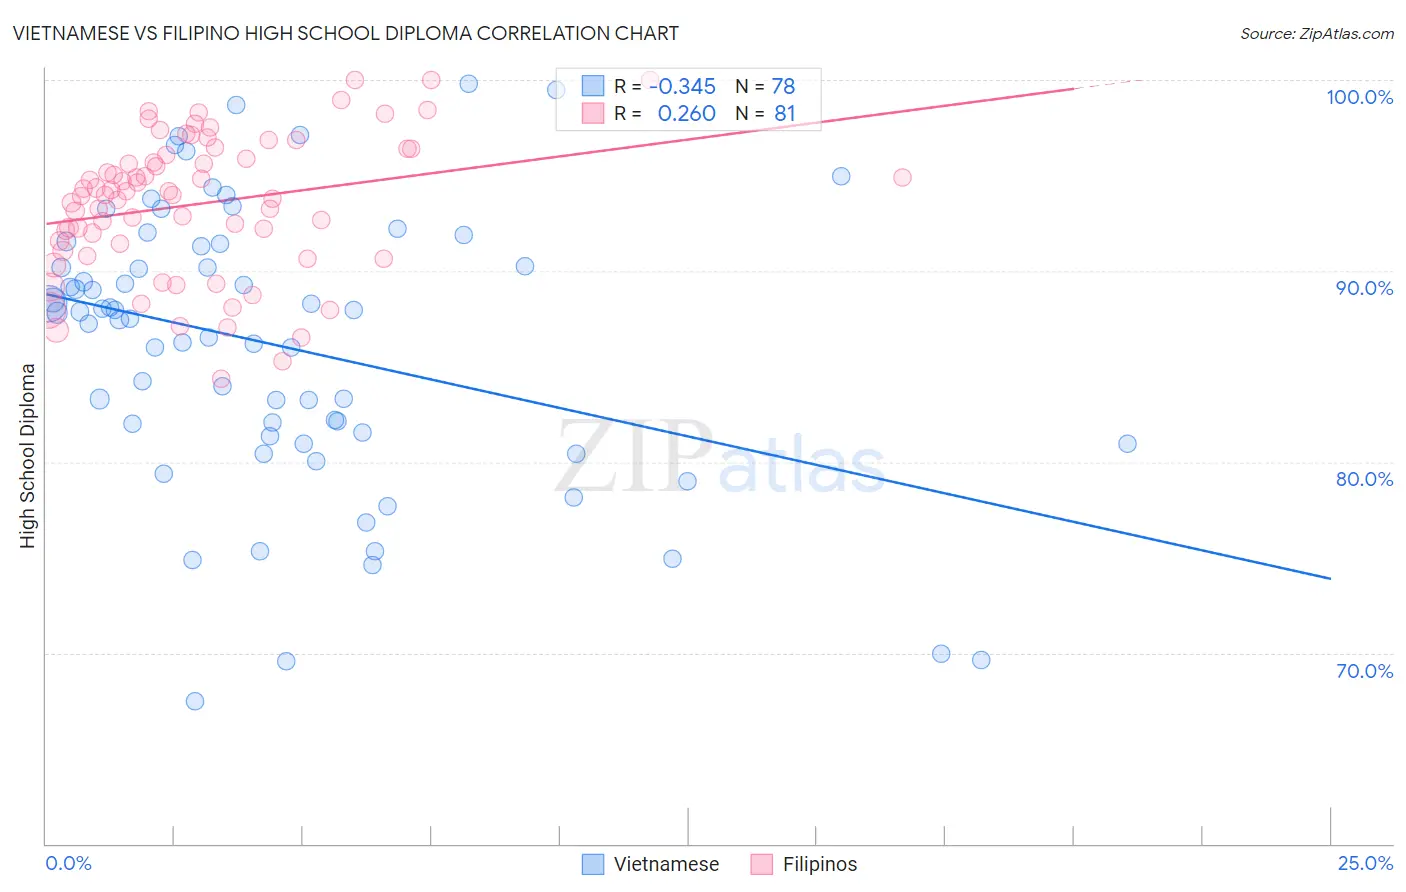
Vietnamese vs Filipino High School Diploma Correlation Chart
The statistical analysis conducted on geographies consisting of 170,753,564 people shows a mild negative correlation between the proportion of Vietnamese and percentage of population with at least high school diploma education in the United States with a correlation coefficient (R) of -0.345 and weighted average of 85.4%. Similarly, the statistical analysis conducted on geographies consisting of 254,351,912 people shows a weak positive correlation between the proportion of Filipinos and percentage of population with at least high school diploma education in the United States with a correlation coefficient (R) of 0.260 and weighted average of 91.6%, a difference of 7.2%.
High School Diploma Correlation Summary
| Measurement | Vietnamese | Filipino |
| Minimum | 67.5% | 84.4% |
| Maximum | 99.8% | 100.0% |
| Range | 32.3% | 15.6% |
| Mean | 86.1% | 93.5% |
| Median | 87.6% | 94.0% |
| Interquartile 25% (IQ1) | 81.3% | 91.2% |
| Interquartile 75% (IQ3) | 91.3% | 96.2% |
| Interquartile Range (IQR) | 9.9% | 5.0% |
| Standard Deviation (Sample) | 7.3% | 3.6% |
| Standard Deviation (Population) | 7.3% | 3.6% |
Similar Demographics by High School Diploma
Demographics Similar to Vietnamese by High School Diploma
In terms of high school diploma, the demographic groups most similar to Vietnamese are Immigrants from Bangladesh (85.5%, a difference of 0.020%), Guyanese (85.5%, a difference of 0.040%), Immigrants from Haiti (85.4%, a difference of 0.040%), Cuban (85.4%, a difference of 0.040%), and Native/Alaskan (85.6%, a difference of 0.14%).
| Demographics | Rating | Rank | High School Diploma |
| Immigrants | Fiji | 0.0 /100 | #294 | Tragic 85.8% |
| Immigrants | Immigrants | 0.0 /100 | #295 | Tragic 85.8% |
| Immigrants | Cambodia | 0.0 /100 | #296 | Tragic 85.6% |
| Immigrants | Grenada | 0.0 /100 | #297 | Tragic 85.6% |
| Natives/Alaskans | 0.0 /100 | #298 | Tragic 85.6% |
| Guyanese | 0.0 /100 | #299 | Tragic 85.5% |
| Immigrants | Bangladesh | 0.0 /100 | #300 | Tragic 85.5% |
| Vietnamese | 0.0 /100 | #301 | Tragic 85.4% |
| Immigrants | Haiti | 0.0 /100 | #302 | Tragic 85.4% |
| Cubans | 0.0 /100 | #303 | Tragic 85.4% |
| Nepalese | 0.0 /100 | #304 | Tragic 85.3% |
| Immigrants | Portugal | 0.0 /100 | #305 | Tragic 85.3% |
| Immigrants | Guyana | 0.0 /100 | #306 | Tragic 85.3% |
| Navajo | 0.0 /100 | #307 | Tragic 85.2% |
| Immigrants | Armenia | 0.0 /100 | #308 | Tragic 85.2% |
Demographics Similar to Filipinos by High School Diploma
In terms of high school diploma, the demographic groups most similar to Filipinos are Czech (91.6%, a difference of 0.010%), Estonian (91.6%, a difference of 0.010%), Maltese (91.6%, a difference of 0.040%), Scandinavian (91.5%, a difference of 0.040%), and Italian (91.5%, a difference of 0.040%).
| Demographics | Rating | Rank | High School Diploma |
| Bulgarians | 100.0 /100 | #14 | Exceptional 91.8% |
| Luxembourgers | 100.0 /100 | #15 | Exceptional 91.7% |
| Finns | 100.0 /100 | #16 | Exceptional 91.7% |
| Immigrants | Singapore | 99.9 /100 | #17 | Exceptional 91.7% |
| Germans | 99.9 /100 | #18 | Exceptional 91.7% |
| Maltese | 99.9 /100 | #19 | Exceptional 91.6% |
| Czechs | 99.9 /100 | #20 | Exceptional 91.6% |
| Filipinos | 99.9 /100 | #21 | Exceptional 91.6% |
| Estonians | 99.9 /100 | #22 | Exceptional 91.6% |
| Scandinavians | 99.9 /100 | #23 | Exceptional 91.5% |
| Italians | 99.9 /100 | #24 | Exceptional 91.5% |
| Thais | 99.9 /100 | #25 | Exceptional 91.5% |
| Russians | 99.9 /100 | #26 | Exceptional 91.5% |
| Cypriots | 99.9 /100 | #27 | Exceptional 91.5% |
| Tlingit-Haida | 99.9 /100 | #28 | Exceptional 91.4% |