Vietnamese vs Blackfeet High School Diploma
COMPARE
Vietnamese
Blackfeet
High School Diploma
High School Diploma Comparison
Vietnamese
Blackfeet
85.4%
HIGH SCHOOL DIPLOMA
0.0/ 100
METRIC RATING
301st/ 347
METRIC RANK
88.1%
HIGH SCHOOL DIPLOMA
4.2/ 100
METRIC RATING
230th/ 347
METRIC RANK
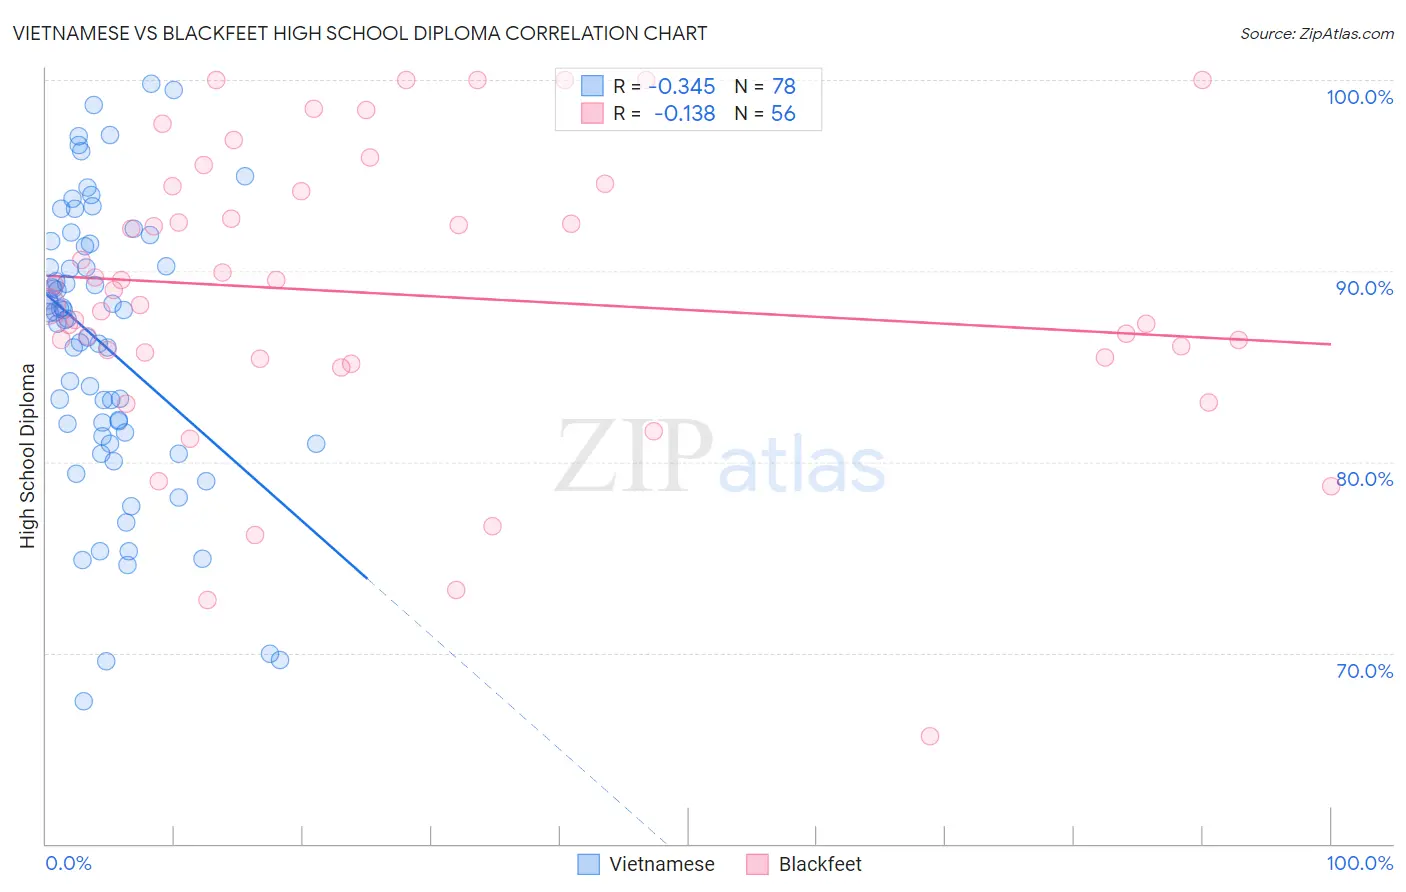
Vietnamese vs Blackfeet High School Diploma Correlation Chart
The statistical analysis conducted on geographies consisting of 170,753,564 people shows a mild negative correlation between the proportion of Vietnamese and percentage of population with at least high school diploma education in the United States with a correlation coefficient (R) of -0.345 and weighted average of 85.4%. Similarly, the statistical analysis conducted on geographies consisting of 309,582,193 people shows a poor negative correlation between the proportion of Blackfeet and percentage of population with at least high school diploma education in the United States with a correlation coefficient (R) of -0.138 and weighted average of 88.1%, a difference of 3.1%.
High School Diploma Correlation Summary
| Measurement | Vietnamese | Blackfeet |
| Minimum | 67.5% | 65.6% |
| Maximum | 99.8% | 100.0% |
| Range | 32.3% | 34.4% |
| Mean | 86.1% | 88.8% |
| Median | 87.6% | 88.6% |
| Interquartile 25% (IQ1) | 81.3% | 85.4% |
| Interquartile 75% (IQ3) | 91.3% | 94.3% |
| Interquartile Range (IQR) | 9.9% | 8.9% |
| Standard Deviation (Sample) | 7.3% | 7.6% |
| Standard Deviation (Population) | 7.3% | 7.5% |
Similar Demographics by High School Diploma
Demographics Similar to Vietnamese by High School Diploma
In terms of high school diploma, the demographic groups most similar to Vietnamese are Immigrants from Bangladesh (85.5%, a difference of 0.020%), Guyanese (85.5%, a difference of 0.040%), Immigrants from Haiti (85.4%, a difference of 0.040%), Cuban (85.4%, a difference of 0.040%), and Native/Alaskan (85.6%, a difference of 0.14%).
| Demographics | Rating | Rank | High School Diploma |
| Immigrants | Fiji | 0.0 /100 | #294 | Tragic 85.8% |
| Immigrants | Immigrants | 0.0 /100 | #295 | Tragic 85.8% |
| Immigrants | Cambodia | 0.0 /100 | #296 | Tragic 85.6% |
| Immigrants | Grenada | 0.0 /100 | #297 | Tragic 85.6% |
| Natives/Alaskans | 0.0 /100 | #298 | Tragic 85.6% |
| Guyanese | 0.0 /100 | #299 | Tragic 85.5% |
| Immigrants | Bangladesh | 0.0 /100 | #300 | Tragic 85.5% |
| Vietnamese | 0.0 /100 | #301 | Tragic 85.4% |
| Immigrants | Haiti | 0.0 /100 | #302 | Tragic 85.4% |
| Cubans | 0.0 /100 | #303 | Tragic 85.4% |
| Nepalese | 0.0 /100 | #304 | Tragic 85.3% |
| Immigrants | Portugal | 0.0 /100 | #305 | Tragic 85.3% |
| Immigrants | Guyana | 0.0 /100 | #306 | Tragic 85.3% |
| Navajo | 0.0 /100 | #307 | Tragic 85.2% |
| Immigrants | Armenia | 0.0 /100 | #308 | Tragic 85.2% |
Demographics Similar to Blackfeet by High School Diploma
In terms of high school diploma, the demographic groups most similar to Blackfeet are Colombian (88.1%, a difference of 0.040%), Nigerian (88.2%, a difference of 0.080%), Kiowa (88.2%, a difference of 0.090%), Immigrants from Middle Africa (88.0%, a difference of 0.090%), and Immigrants from Liberia (88.2%, a difference of 0.10%).
| Demographics | Rating | Rank | High School Diploma |
| Immigrants | Zaire | 7.6 /100 | #223 | Tragic 88.3% |
| Shoshone | 7.0 /100 | #224 | Tragic 88.3% |
| Creek | 6.9 /100 | #225 | Tragic 88.3% |
| Uruguayans | 5.6 /100 | #226 | Tragic 88.2% |
| Immigrants | Liberia | 5.5 /100 | #227 | Tragic 88.2% |
| Kiowa | 5.3 /100 | #228 | Tragic 88.2% |
| Nigerians | 5.2 /100 | #229 | Tragic 88.2% |
| Blackfeet | 4.2 /100 | #230 | Tragic 88.1% |
| Colombians | 3.8 /100 | #231 | Tragic 88.1% |
| Immigrants | Middle Africa | 3.4 /100 | #232 | Tragic 88.0% |
| Immigrants | Panama | 3.1 /100 | #233 | Tragic 88.0% |
| Immigrants | Thailand | 3.1 /100 | #234 | Tragic 88.0% |
| Immigrants | Bahamas | 2.9 /100 | #235 | Tragic 88.0% |
| Sub-Saharan Africans | 2.8 /100 | #236 | Tragic 87.9% |
| Taiwanese | 2.8 /100 | #237 | Tragic 87.9% |