Venezuelan vs Immigrants from Zaire Doctorate Degree
COMPARE
Venezuelan
Immigrants from Zaire
Doctorate Degree
Doctorate Degree Comparison
Venezuelans
Immigrants from Zaire
1.7%
DOCTORATE DEGREE
19.5/ 100
METRIC RATING
205th/ 347
METRIC RANK
2.0%
DOCTORATE DEGREE
91.1/ 100
METRIC RATING
128th/ 347
METRIC RANK
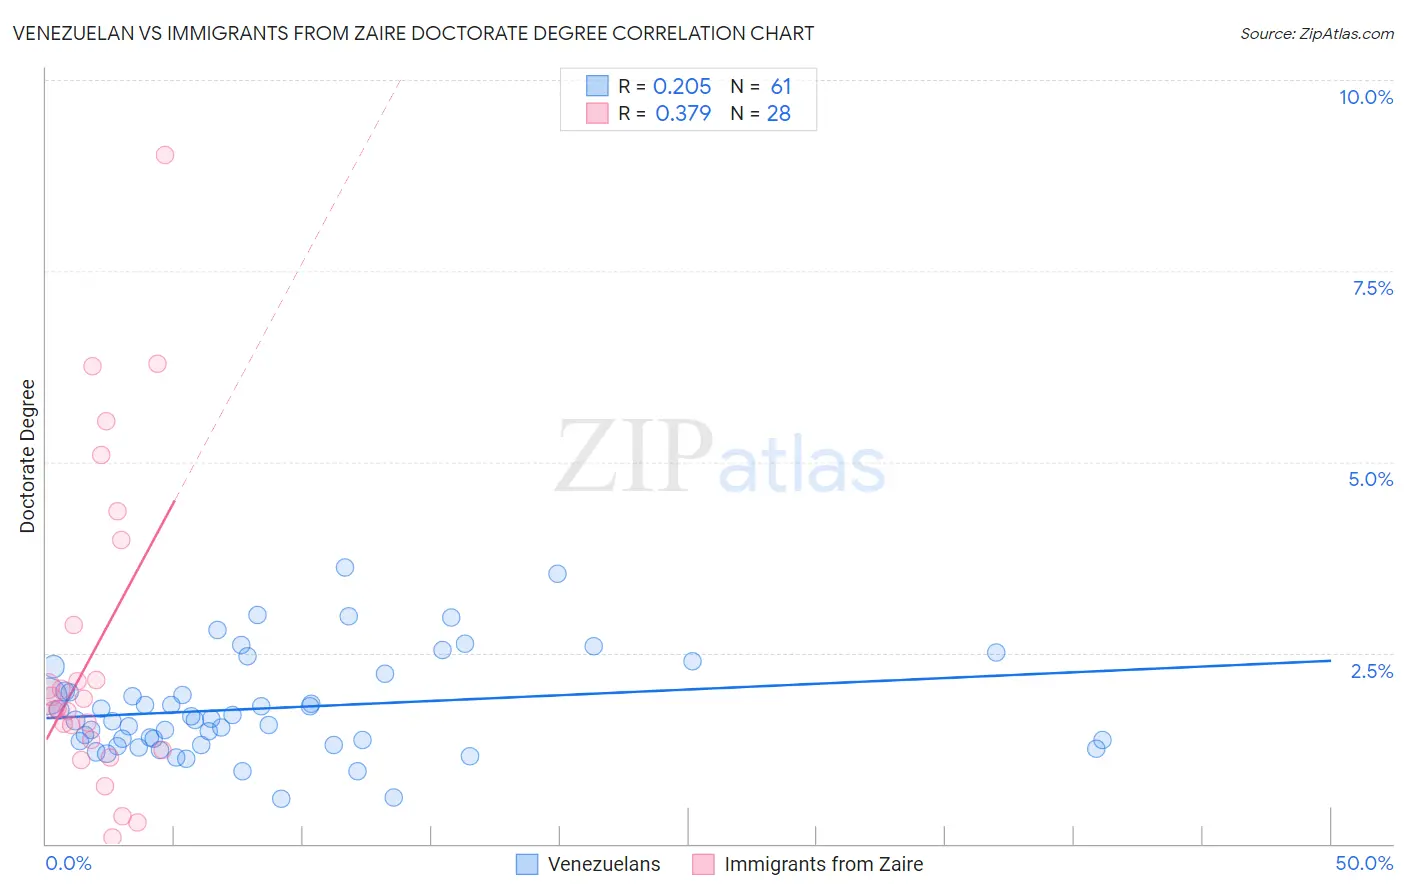
Venezuelan vs Immigrants from Zaire Doctorate Degree Correlation Chart
The statistical analysis conducted on geographies consisting of 304,663,259 people shows a weak positive correlation between the proportion of Venezuelans and percentage of population with at least doctorate degree education in the United States with a correlation coefficient (R) of 0.205 and weighted average of 1.7%. Similarly, the statistical analysis conducted on geographies consisting of 107,152,130 people shows a mild positive correlation between the proportion of Immigrants from Zaire and percentage of population with at least doctorate degree education in the United States with a correlation coefficient (R) of 0.379 and weighted average of 2.0%, a difference of 14.5%.
Doctorate Degree Correlation Summary
| Measurement | Venezuelan | Immigrants from Zaire |
| Minimum | 0.59% | 0.076% |
| Maximum | 3.6% | 9.0% |
| Range | 3.0% | 8.9% |
| Mean | 1.8% | 2.6% |
| Median | 1.6% | 1.8% |
| Interquartile 25% (IQ1) | 1.3% | 1.3% |
| Interquartile 75% (IQ3) | 2.1% | 3.4% |
| Interquartile Range (IQR) | 0.78% | 2.1% |
| Standard Deviation (Sample) | 0.66% | 2.1% |
| Standard Deviation (Population) | 0.65% | 2.1% |
Similar Demographics by Doctorate Degree
Demographics Similar to Venezuelans by Doctorate Degree
In terms of doctorate degree, the demographic groups most similar to Venezuelans are Somali (1.7%, a difference of 0.41%), Immigrants from Vietnam (1.8%, a difference of 0.44%), Portuguese (1.8%, a difference of 0.46%), Immigrants from Peru (1.7%, a difference of 0.48%), and Yugoslavian (1.7%, a difference of 0.64%).
| Demographics | Rating | Rank | Doctorate Degree |
| Immigrants | Ghana | 24.6 /100 | #198 | Fair 1.8% |
| Immigrants | South America | 23.3 /100 | #199 | Fair 1.8% |
| Whites/Caucasians | 22.8 /100 | #200 | Fair 1.8% |
| Immigrants | Nigeria | 22.4 /100 | #201 | Fair 1.8% |
| Portuguese | 21.4 /100 | #202 | Fair 1.8% |
| Immigrants | Vietnam | 21.4 /100 | #203 | Fair 1.8% |
| Somalis | 21.2 /100 | #204 | Fair 1.7% |
| Venezuelans | 19.5 /100 | #205 | Poor 1.7% |
| Immigrants | Peru | 17.6 /100 | #206 | Poor 1.7% |
| Yugoslavians | 17.1 /100 | #207 | Poor 1.7% |
| Colombians | 16.1 /100 | #208 | Poor 1.7% |
| Immigrants | Western Africa | 15.4 /100 | #209 | Poor 1.7% |
| Tongans | 15.1 /100 | #210 | Poor 1.7% |
| Immigrants | Armenia | 15.1 /100 | #211 | Poor 1.7% |
| Immigrants | South Eastern Asia | 14.7 /100 | #212 | Poor 1.7% |
Demographics Similar to Immigrants from Zaire by Doctorate Degree
In terms of doctorate degree, the demographic groups most similar to Immigrants from Zaire are Canadian (2.0%, a difference of 0.22%), Immigrants from Ukraine (2.0%, a difference of 0.22%), Immigrants from Sierra Leone (2.0%, a difference of 0.36%), Palestinian (2.0%, a difference of 0.42%), and Jordanian (2.0%, a difference of 0.46%).
| Demographics | Rating | Rank | Doctorate Degree |
| Immigrants | Jordan | 94.8 /100 | #121 | Exceptional 2.0% |
| Immigrants | Southern Europe | 94.7 /100 | #122 | Exceptional 2.0% |
| Croatians | 94.0 /100 | #123 | Exceptional 2.0% |
| Ute | 93.2 /100 | #124 | Exceptional 2.0% |
| Moroccans | 93.0 /100 | #125 | Exceptional 2.0% |
| Jordanians | 92.1 /100 | #126 | Exceptional 2.0% |
| Palestinians | 92.0 /100 | #127 | Exceptional 2.0% |
| Immigrants | Zaire | 91.1 /100 | #128 | Exceptional 2.0% |
| Canadians | 90.6 /100 | #129 | Exceptional 2.0% |
| Immigrants | Ukraine | 90.5 /100 | #130 | Exceptional 2.0% |
| Immigrants | Sierra Leone | 90.2 /100 | #131 | Exceptional 2.0% |
| Scottish | 89.4 /100 | #132 | Excellent 2.0% |
| Immigrants | Uzbekistan | 89.3 /100 | #133 | Excellent 2.0% |
| Immigrants | Cameroon | 88.9 /100 | #134 | Excellent 2.0% |
| Serbians | 88.7 /100 | #135 | Excellent 2.0% |