Dutch West Indian vs Paiute High School Diploma
COMPARE
Dutch West Indian
Paiute
High School Diploma
High School Diploma Comparison
Dutch West Indians
Paiute
86.5%
HIGH SCHOOL DIPLOMA
0.0/ 100
METRIC RATING
282nd/ 347
METRIC RANK
86.4%
HIGH SCHOOL DIPLOMA
0.0/ 100
METRIC RATING
284th/ 347
METRIC RANK
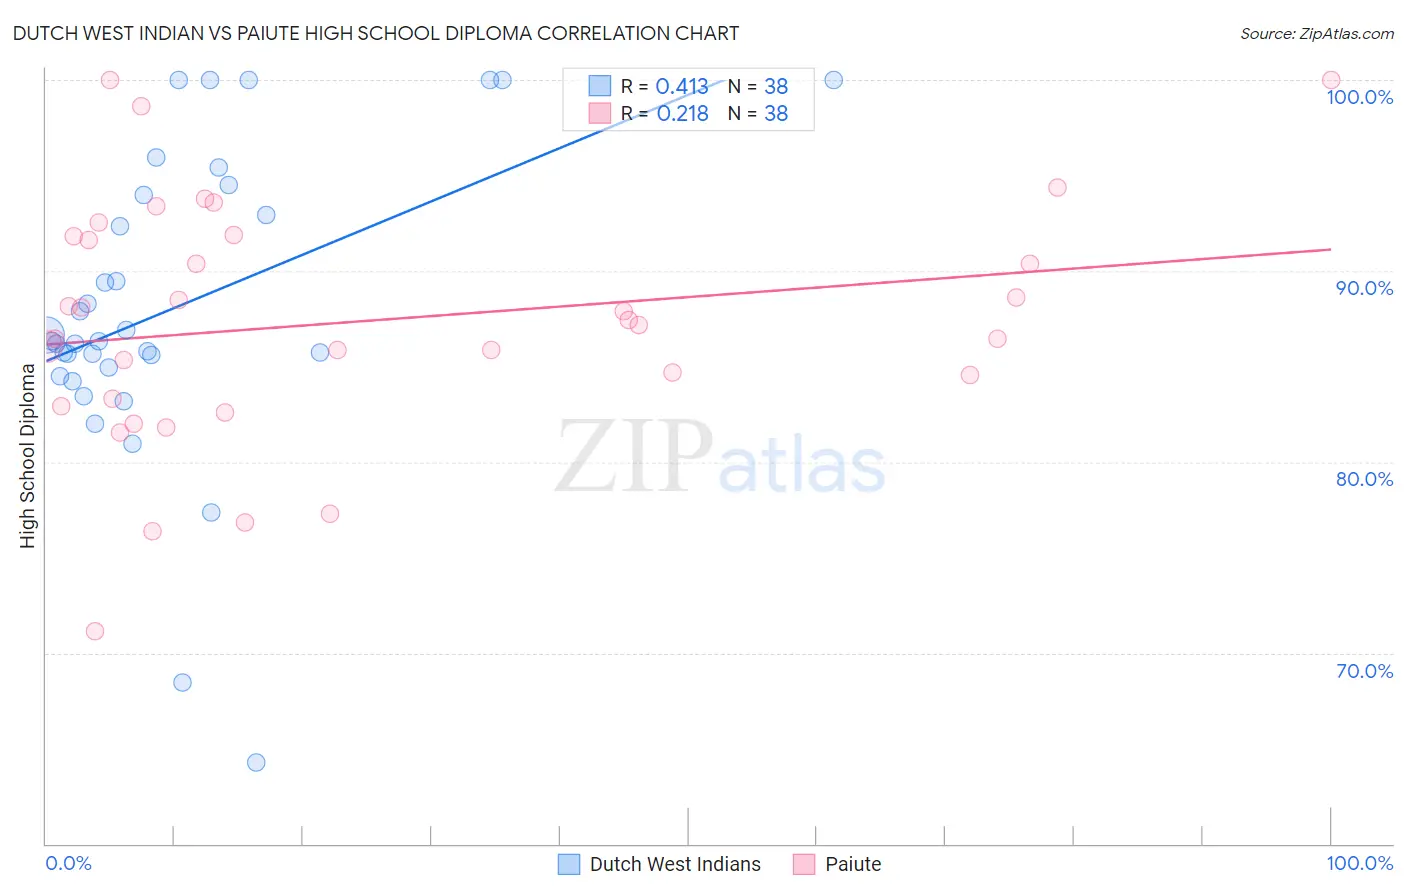
Dutch West Indian vs Paiute High School Diploma Correlation Chart
The statistical analysis conducted on geographies consisting of 85,776,098 people shows a moderate positive correlation between the proportion of Dutch West Indians and percentage of population with at least high school diploma education in the United States with a correlation coefficient (R) of 0.413 and weighted average of 86.5%. Similarly, the statistical analysis conducted on geographies consisting of 58,404,248 people shows a weak positive correlation between the proportion of Paiute and percentage of population with at least high school diploma education in the United States with a correlation coefficient (R) of 0.218 and weighted average of 86.4%, a difference of 0.10%.
High School Diploma Correlation Summary
| Measurement | Dutch West Indian | Paiute |
| Minimum | 64.3% | 71.1% |
| Maximum | 100.0% | 100.0% |
| Range | 35.7% | 28.9% |
| Mean | 88.1% | 87.3% |
| Median | 86.3% | 87.3% |
| Interquartile 25% (IQ1) | 84.9% | 83.3% |
| Interquartile 75% (IQ3) | 94.0% | 91.8% |
| Interquartile Range (IQR) | 9.1% | 8.5% |
| Standard Deviation (Sample) | 8.0% | 6.4% |
| Standard Deviation (Population) | 7.9% | 6.3% |
Demographics Similar to Dutch West Indians and Paiute by High School Diploma
In terms of high school diploma, the demographic groups most similar to Dutch West Indians are Indonesian (86.5%, a difference of 0.040%), Immigrants from Barbados (86.4%, a difference of 0.060%), Pueblo (86.5%, a difference of 0.090%), Immigrants from Laos (86.6%, a difference of 0.11%), and Hopi (86.6%, a difference of 0.16%). Similarly, the demographic groups most similar to Paiute are Immigrants from Barbados (86.4%, a difference of 0.050%), Indonesian (86.5%, a difference of 0.15%), Pueblo (86.5%, a difference of 0.20%), Immigrants from West Indies (86.2%, a difference of 0.20%), and Immigrants from Laos (86.6%, a difference of 0.21%).
| Demographics | Rating | Rank | High School Diploma |
| Immigrants | Jamaica | 0.1 /100 | #273 | Tragic 86.9% |
| Bangladeshis | 0.1 /100 | #274 | Tragic 86.9% |
| Immigrants | Trinidad and Tobago | 0.1 /100 | #275 | Tragic 86.8% |
| Immigrants | Burma/Myanmar | 0.1 /100 | #276 | Tragic 86.7% |
| Barbadians | 0.1 /100 | #277 | Tragic 86.7% |
| Hopi | 0.1 /100 | #278 | Tragic 86.6% |
| Immigrants | Laos | 0.0 /100 | #279 | Tragic 86.6% |
| Pueblo | 0.0 /100 | #280 | Tragic 86.5% |
| Indonesians | 0.0 /100 | #281 | Tragic 86.5% |
| Dutch West Indians | 0.0 /100 | #282 | Tragic 86.5% |
| Immigrants | Barbados | 0.0 /100 | #283 | Tragic 86.4% |
| Paiute | 0.0 /100 | #284 | Tragic 86.4% |
| Immigrants | West Indies | 0.0 /100 | #285 | Tragic 86.2% |
| Immigrants | St. Vincent and the Grenadines | 0.0 /100 | #286 | Tragic 86.2% |
| Ute | 0.0 /100 | #287 | Tragic 86.2% |
| Immigrants | Vietnam | 0.0 /100 | #288 | Tragic 86.2% |
| Yup'ik | 0.0 /100 | #289 | Tragic 86.1% |
| Fijians | 0.0 /100 | #290 | Tragic 86.0% |
| Haitians | 0.0 /100 | #291 | Tragic 85.9% |
| Japanese | 0.0 /100 | #292 | Tragic 85.9% |
| British West Indians | 0.0 /100 | #293 | Tragic 85.9% |