Immigrants from Zaire vs Paiute High School Diploma
COMPARE
Immigrants from Zaire
Paiute
High School Diploma
High School Diploma Comparison
Immigrants from Zaire
Paiute
88.3%
HIGH SCHOOL DIPLOMA
7.6/ 100
METRIC RATING
223rd/ 347
METRIC RANK
86.4%
HIGH SCHOOL DIPLOMA
0.0/ 100
METRIC RATING
284th/ 347
METRIC RANK
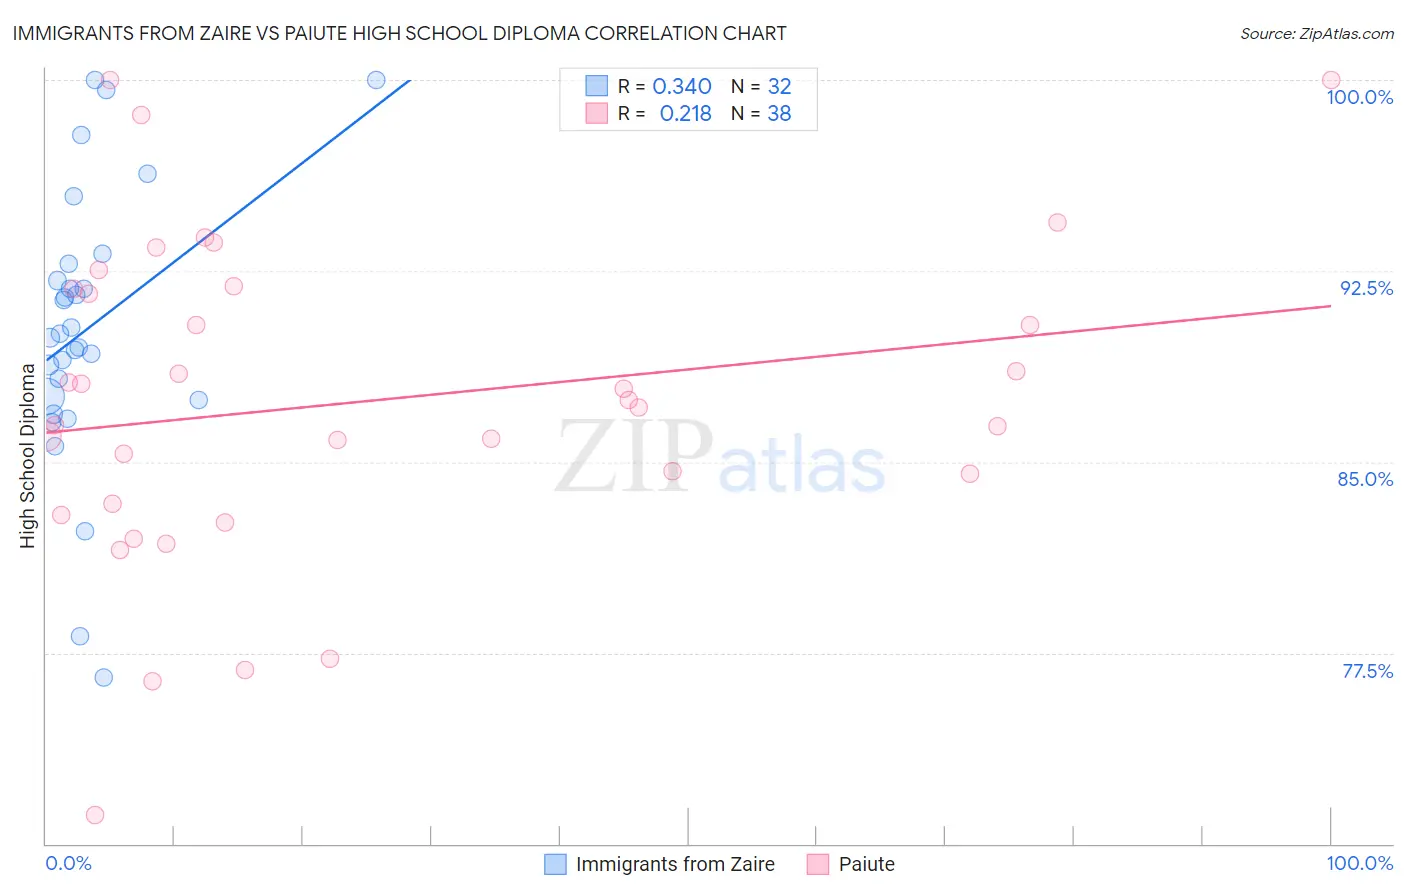
Immigrants from Zaire vs Paiute High School Diploma Correlation Chart
The statistical analysis conducted on geographies consisting of 107,255,805 people shows a mild positive correlation between the proportion of Immigrants from Zaire and percentage of population with at least high school diploma education in the United States with a correlation coefficient (R) of 0.340 and weighted average of 88.3%. Similarly, the statistical analysis conducted on geographies consisting of 58,404,248 people shows a weak positive correlation between the proportion of Paiute and percentage of population with at least high school diploma education in the United States with a correlation coefficient (R) of 0.218 and weighted average of 86.4%, a difference of 2.2%.
High School Diploma Correlation Summary
| Measurement | Immigrants from Zaire | Paiute |
| Minimum | 76.5% | 71.1% |
| Maximum | 100.0% | 100.0% |
| Range | 23.5% | 28.9% |
| Mean | 90.2% | 87.3% |
| Median | 90.0% | 87.3% |
| Interquartile 25% (IQ1) | 87.5% | 83.3% |
| Interquartile 75% (IQ3) | 92.5% | 91.8% |
| Interquartile Range (IQR) | 5.0% | 8.5% |
| Standard Deviation (Sample) | 5.4% | 6.4% |
| Standard Deviation (Population) | 5.3% | 6.3% |
Similar Demographics by High School Diploma
Demographics Similar to Immigrants from Zaire by High School Diploma
In terms of high school diploma, the demographic groups most similar to Immigrants from Zaire are Colville (88.3%, a difference of 0.010%), Shoshone (88.3%, a difference of 0.040%), Creek (88.3%, a difference of 0.040%), Immigrants from Afghanistan (88.3%, a difference of 0.050%), and Tongan (88.4%, a difference of 0.090%).
| Demographics | Rating | Rank | High School Diploma |
| Chickasaw | 10.7 /100 | #216 | Poor 88.4% |
| Immigrants | Africa | 10.6 /100 | #217 | Poor 88.4% |
| Immigrants | Bolivia | 10.3 /100 | #218 | Poor 88.4% |
| Costa Ricans | 9.6 /100 | #219 | Tragic 88.4% |
| Tongans | 9.5 /100 | #220 | Tragic 88.4% |
| Immigrants | Afghanistan | 8.6 /100 | #221 | Tragic 88.3% |
| Colville | 7.8 /100 | #222 | Tragic 88.3% |
| Immigrants | Zaire | 7.6 /100 | #223 | Tragic 88.3% |
| Shoshone | 7.0 /100 | #224 | Tragic 88.3% |
| Creek | 6.9 /100 | #225 | Tragic 88.3% |
| Uruguayans | 5.6 /100 | #226 | Tragic 88.2% |
| Immigrants | Liberia | 5.5 /100 | #227 | Tragic 88.2% |
| Kiowa | 5.3 /100 | #228 | Tragic 88.2% |
| Nigerians | 5.2 /100 | #229 | Tragic 88.2% |
| Blackfeet | 4.2 /100 | #230 | Tragic 88.1% |
Demographics Similar to Paiute by High School Diploma
In terms of high school diploma, the demographic groups most similar to Paiute are Immigrants from Barbados (86.4%, a difference of 0.050%), Dutch West Indian (86.5%, a difference of 0.10%), Indonesian (86.5%, a difference of 0.15%), Pueblo (86.5%, a difference of 0.20%), and Immigrants from West Indies (86.2%, a difference of 0.20%).
| Demographics | Rating | Rank | High School Diploma |
| Barbadians | 0.1 /100 | #277 | Tragic 86.7% |
| Hopi | 0.1 /100 | #278 | Tragic 86.6% |
| Immigrants | Laos | 0.0 /100 | #279 | Tragic 86.6% |
| Pueblo | 0.0 /100 | #280 | Tragic 86.5% |
| Indonesians | 0.0 /100 | #281 | Tragic 86.5% |
| Dutch West Indians | 0.0 /100 | #282 | Tragic 86.5% |
| Immigrants | Barbados | 0.0 /100 | #283 | Tragic 86.4% |
| Paiute | 0.0 /100 | #284 | Tragic 86.4% |
| Immigrants | West Indies | 0.0 /100 | #285 | Tragic 86.2% |
| Immigrants | St. Vincent and the Grenadines | 0.0 /100 | #286 | Tragic 86.2% |
| Ute | 0.0 /100 | #287 | Tragic 86.2% |
| Immigrants | Vietnam | 0.0 /100 | #288 | Tragic 86.2% |
| Yup'ik | 0.0 /100 | #289 | Tragic 86.1% |
| Fijians | 0.0 /100 | #290 | Tragic 86.0% |
| Haitians | 0.0 /100 | #291 | Tragic 85.9% |