Immigrants from Cuba vs Paiute High School Diploma
COMPARE
Immigrants from Cuba
Paiute
High School Diploma
High School Diploma Comparison
Immigrants from Cuba
Paiute
83.5%
HIGH SCHOOL DIPLOMA
0.0/ 100
METRIC RATING
323rd/ 347
METRIC RANK
86.4%
HIGH SCHOOL DIPLOMA
0.0/ 100
METRIC RATING
284th/ 347
METRIC RANK
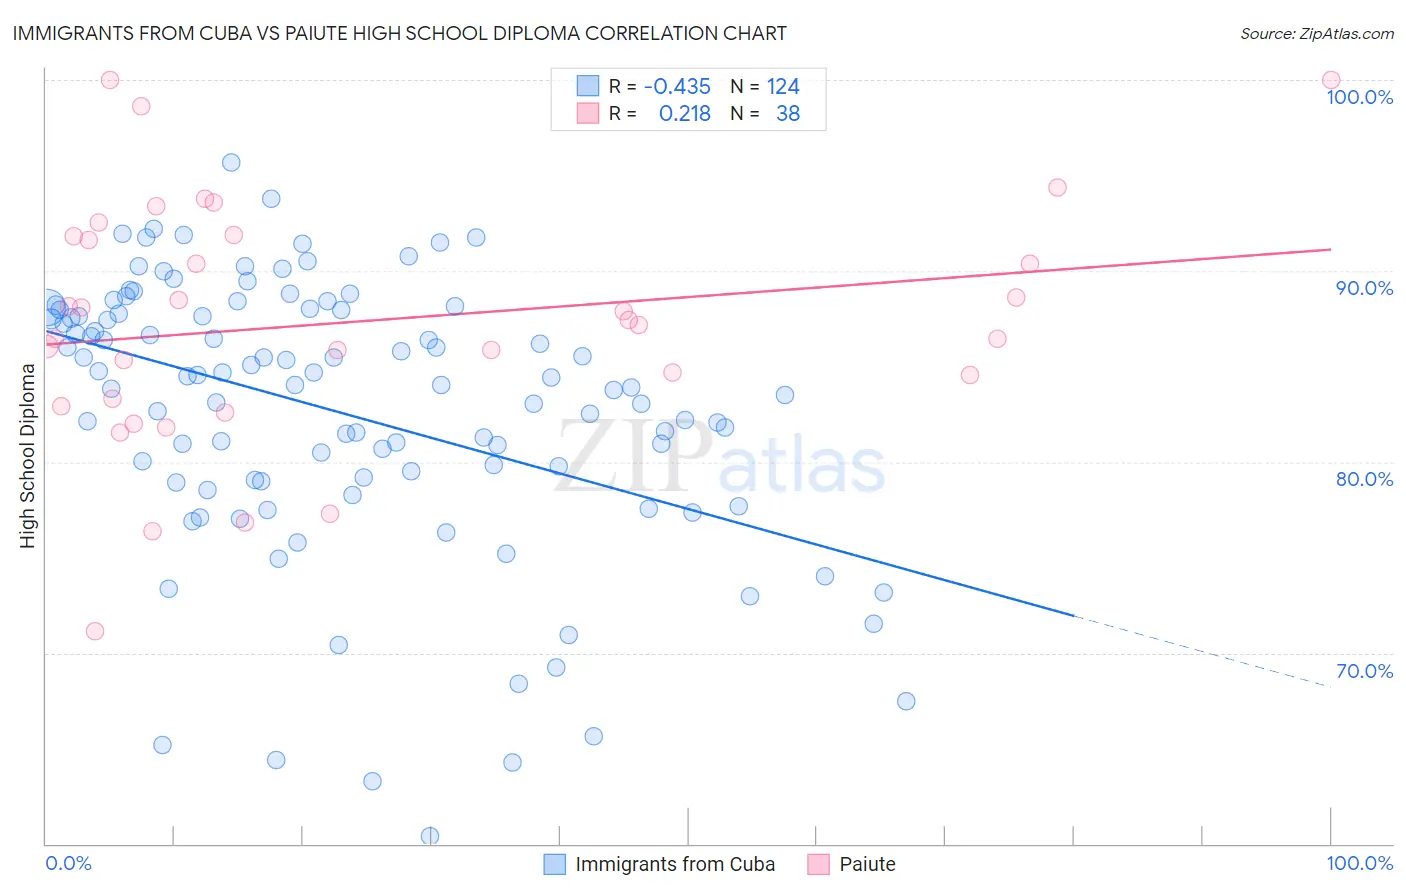
Immigrants from Cuba vs Paiute High School Diploma Correlation Chart
The statistical analysis conducted on geographies consisting of 326,028,082 people shows a moderate negative correlation between the proportion of Immigrants from Cuba and percentage of population with at least high school diploma education in the United States with a correlation coefficient (R) of -0.435 and weighted average of 83.5%. Similarly, the statistical analysis conducted on geographies consisting of 58,404,248 people shows a weak positive correlation between the proportion of Paiute and percentage of population with at least high school diploma education in the United States with a correlation coefficient (R) of 0.218 and weighted average of 86.4%, a difference of 3.4%.
High School Diploma Correlation Summary
| Measurement | Immigrants from Cuba | Paiute |
| Minimum | 60.4% | 71.1% |
| Maximum | 95.7% | 100.0% |
| Range | 35.2% | 28.9% |
| Mean | 82.6% | 87.3% |
| Median | 84.0% | 87.3% |
| Interquartile 25% (IQ1) | 79.0% | 83.3% |
| Interquartile 75% (IQ3) | 87.9% | 91.8% |
| Interquartile Range (IQR) | 8.8% | 8.5% |
| Standard Deviation (Sample) | 7.1% | 6.4% |
| Standard Deviation (Population) | 7.1% | 6.3% |
Similar Demographics by High School Diploma
Demographics Similar to Immigrants from Cuba by High School Diploma
In terms of high school diploma, the demographic groups most similar to Immigrants from Cuba are Lumbee (83.6%, a difference of 0.16%), Immigrants from Cabo Verde (83.3%, a difference of 0.29%), Immigrants from Nicaragua (83.1%, a difference of 0.52%), Yuman (84.0%, a difference of 0.57%), and Mexican American Indian (83.0%, a difference of 0.59%).
| Demographics | Rating | Rank | High School Diploma |
| Belizeans | 0.0 /100 | #316 | Tragic 84.3% |
| Immigrants | Caribbean | 0.0 /100 | #317 | Tragic 84.3% |
| Immigrants | Belize | 0.0 /100 | #318 | Tragic 84.2% |
| Central American Indians | 0.0 /100 | #319 | Tragic 84.2% |
| Nicaraguans | 0.0 /100 | #320 | Tragic 84.1% |
| Yuman | 0.0 /100 | #321 | Tragic 84.0% |
| Lumbee | 0.0 /100 | #322 | Tragic 83.6% |
| Immigrants | Cuba | 0.0 /100 | #323 | Tragic 83.5% |
| Immigrants | Cabo Verde | 0.0 /100 | #324 | Tragic 83.3% |
| Immigrants | Nicaragua | 0.0 /100 | #325 | Tragic 83.1% |
| Mexican American Indians | 0.0 /100 | #326 | Tragic 83.0% |
| Hondurans | 0.0 /100 | #327 | Tragic 83.0% |
| Dominicans | 0.0 /100 | #328 | Tragic 82.9% |
| Hispanics or Latinos | 0.0 /100 | #329 | Tragic 82.9% |
| Immigrants | Azores | 0.0 /100 | #330 | Tragic 82.8% |
Demographics Similar to Paiute by High School Diploma
In terms of high school diploma, the demographic groups most similar to Paiute are Immigrants from Barbados (86.4%, a difference of 0.050%), Dutch West Indian (86.5%, a difference of 0.10%), Indonesian (86.5%, a difference of 0.15%), Pueblo (86.5%, a difference of 0.20%), and Immigrants from West Indies (86.2%, a difference of 0.20%).
| Demographics | Rating | Rank | High School Diploma |
| Barbadians | 0.1 /100 | #277 | Tragic 86.7% |
| Hopi | 0.1 /100 | #278 | Tragic 86.6% |
| Immigrants | Laos | 0.0 /100 | #279 | Tragic 86.6% |
| Pueblo | 0.0 /100 | #280 | Tragic 86.5% |
| Indonesians | 0.0 /100 | #281 | Tragic 86.5% |
| Dutch West Indians | 0.0 /100 | #282 | Tragic 86.5% |
| Immigrants | Barbados | 0.0 /100 | #283 | Tragic 86.4% |
| Paiute | 0.0 /100 | #284 | Tragic 86.4% |
| Immigrants | West Indies | 0.0 /100 | #285 | Tragic 86.2% |
| Immigrants | St. Vincent and the Grenadines | 0.0 /100 | #286 | Tragic 86.2% |
| Ute | 0.0 /100 | #287 | Tragic 86.2% |
| Immigrants | Vietnam | 0.0 /100 | #288 | Tragic 86.2% |
| Yup'ik | 0.0 /100 | #289 | Tragic 86.1% |
| Fijians | 0.0 /100 | #290 | Tragic 86.0% |
| Haitians | 0.0 /100 | #291 | Tragic 85.9% |