Venezuelan vs Sri Lankan High School Diploma
COMPARE
Venezuelan
Sri Lankan
High School Diploma
High School Diploma Comparison
Venezuelans
Sri Lankans
89.1%
HIGH SCHOOL DIPLOMA
43.6/ 100
METRIC RATING
181st/ 347
METRIC RANK
87.0%
HIGH SCHOOL DIPLOMA
0.2/ 100
METRIC RATING
269th/ 347
METRIC RANK
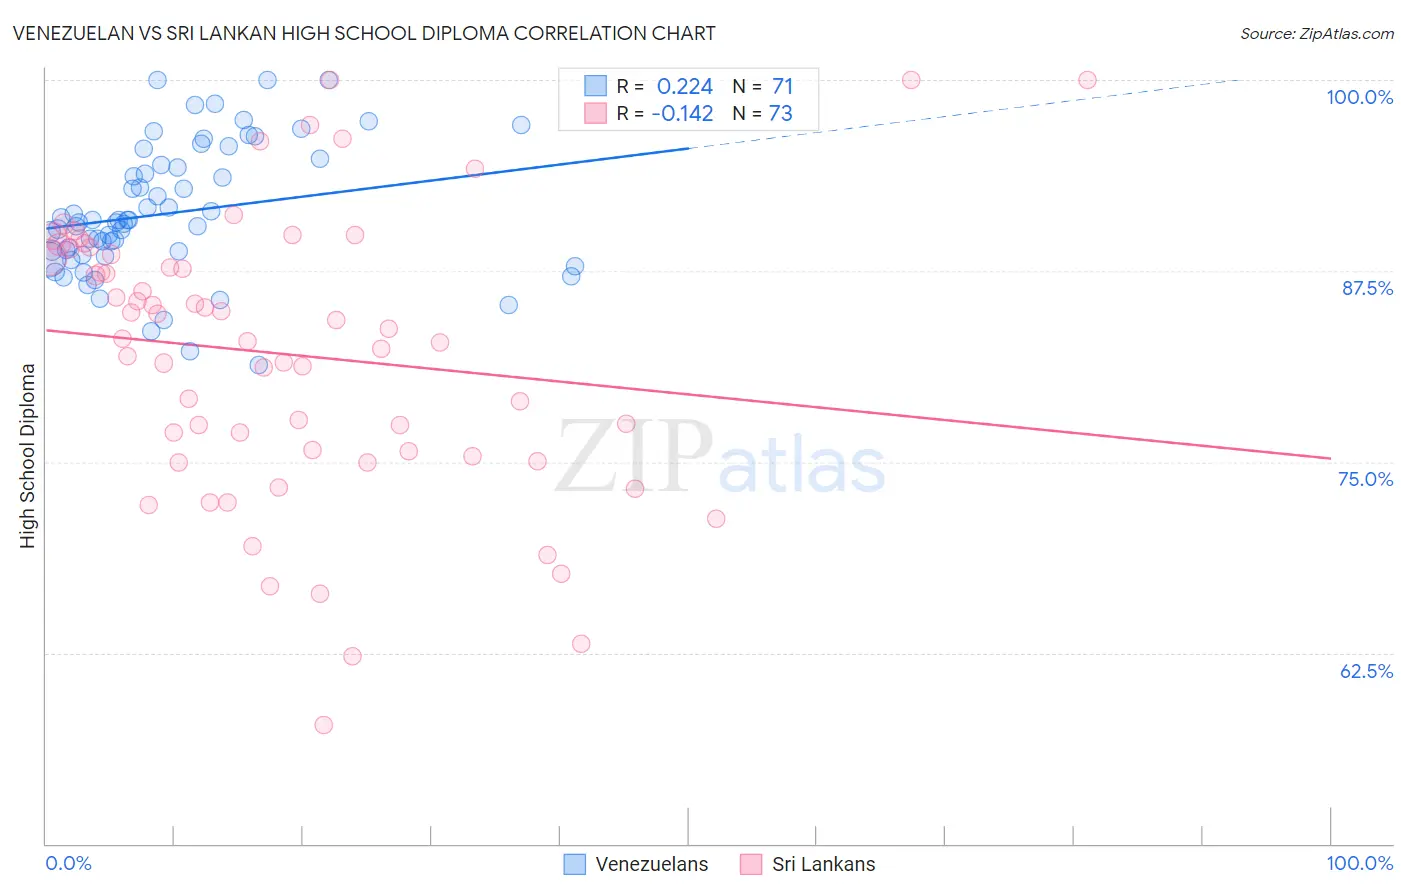
Venezuelan vs Sri Lankan High School Diploma Correlation Chart
The statistical analysis conducted on geographies consisting of 306,323,638 people shows a weak positive correlation between the proportion of Venezuelans and percentage of population with at least high school diploma education in the United States with a correlation coefficient (R) of 0.224 and weighted average of 89.1%. Similarly, the statistical analysis conducted on geographies consisting of 440,593,537 people shows a poor negative correlation between the proportion of Sri Lankans and percentage of population with at least high school diploma education in the United States with a correlation coefficient (R) of -0.142 and weighted average of 87.0%, a difference of 2.4%.
High School Diploma Correlation Summary
| Measurement | Venezuelan | Sri Lankan |
| Minimum | 81.3% | 57.8% |
| Maximum | 100.0% | 100.0% |
| Range | 18.7% | 42.2% |
| Mean | 91.3% | 82.1% |
| Median | 90.7% | 83.1% |
| Interquartile 25% (IQ1) | 88.5% | 75.5% |
| Interquartile 75% (IQ3) | 94.4% | 88.8% |
| Interquartile Range (IQR) | 5.9% | 13.3% |
| Standard Deviation (Sample) | 4.3% | 9.2% |
| Standard Deviation (Population) | 4.2% | 9.1% |
Similar Demographics by High School Diploma
Demographics Similar to Venezuelans by High School Diploma
In terms of high school diploma, the demographic groups most similar to Venezuelans are Spaniard (89.1%, a difference of 0.0%), Bolivian (89.1%, a difference of 0.020%), Potawatomi (89.0%, a difference of 0.020%), American (89.1%, a difference of 0.050%), and Sudanese (89.1%, a difference of 0.070%).
| Demographics | Rating | Rank | High School Diploma |
| Hmong | 50.0 /100 | #174 | Average 89.1% |
| Immigrants | Western Asia | 49.0 /100 | #175 | Average 89.1% |
| Osage | 48.9 /100 | #176 | Average 89.1% |
| Sudanese | 48.5 /100 | #177 | Average 89.1% |
| Sierra Leoneans | 48.4 /100 | #178 | Average 89.1% |
| Americans | 47.2 /100 | #179 | Average 89.1% |
| Bolivians | 45.2 /100 | #180 | Average 89.1% |
| Venezuelans | 43.6 /100 | #181 | Average 89.1% |
| Spaniards | 43.4 /100 | #182 | Average 89.1% |
| Potawatomi | 42.5 /100 | #183 | Average 89.0% |
| Immigrants | Syria | 39.2 /100 | #184 | Fair 89.0% |
| Ethiopians | 37.0 /100 | #185 | Fair 89.0% |
| Immigrants | Eastern Africa | 35.8 /100 | #186 | Fair 88.9% |
| Guamanians/Chamorros | 35.5 /100 | #187 | Fair 88.9% |
| Immigrants | Sudan | 33.4 /100 | #188 | Fair 88.9% |
Demographics Similar to Sri Lankans by High School Diploma
In terms of high school diploma, the demographic groups most similar to Sri Lankans are Pennsylvania German (87.0%, a difference of 0.010%), Malaysian (87.0%, a difference of 0.010%), Black/African American (87.0%, a difference of 0.040%), Immigrants from Congo (87.0%, a difference of 0.050%), and West Indian (86.9%, a difference of 0.080%).
| Demographics | Rating | Rank | High School Diploma |
| Immigrants | Peru | 0.4 /100 | #262 | Tragic 87.3% |
| Immigrants | South Eastern Asia | 0.3 /100 | #263 | Tragic 87.2% |
| Jamaicans | 0.3 /100 | #264 | Tragic 87.2% |
| U.S. Virgin Islanders | 0.2 /100 | #265 | Tragic 87.1% |
| Immigrants | Congo | 0.2 /100 | #266 | Tragic 87.0% |
| Blacks/African Americans | 0.2 /100 | #267 | Tragic 87.0% |
| Pennsylvania Germans | 0.2 /100 | #268 | Tragic 87.0% |
| Sri Lankans | 0.2 /100 | #269 | Tragic 87.0% |
| Malaysians | 0.2 /100 | #270 | Tragic 87.0% |
| West Indians | 0.1 /100 | #271 | Tragic 86.9% |
| Trinidadians and Tobagonians | 0.1 /100 | #272 | Tragic 86.9% |
| Immigrants | Jamaica | 0.1 /100 | #273 | Tragic 86.9% |
| Bangladeshis | 0.1 /100 | #274 | Tragic 86.9% |
| Immigrants | Trinidad and Tobago | 0.1 /100 | #275 | Tragic 86.8% |
| Immigrants | Burma/Myanmar | 0.1 /100 | #276 | Tragic 86.7% |