Dutch West Indian vs Maltese Bachelor's Degree
COMPARE
Dutch West Indian
Maltese
Bachelor's Degree
Bachelor's Degree Comparison
Dutch West Indians
Maltese
28.5%
BACHELOR'S DEGREE
0.0/ 100
METRIC RATING
324th/ 347
METRIC RANK
41.9%
BACHELOR'S DEGREE
98.8/ 100
METRIC RATING
92nd/ 347
METRIC RANK
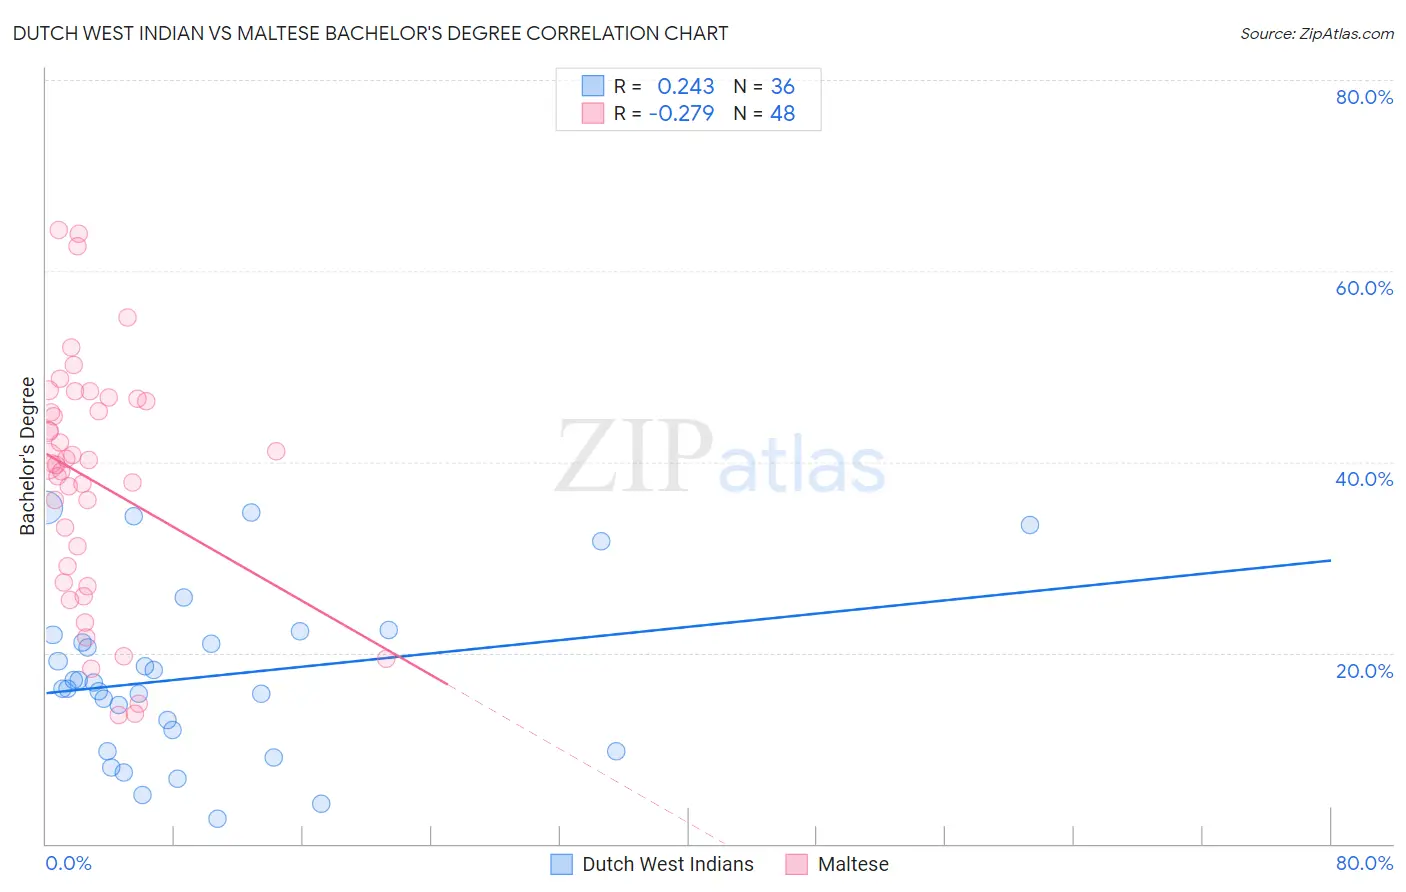
Dutch West Indian vs Maltese Bachelor's Degree Correlation Chart
The statistical analysis conducted on geographies consisting of 85,775,011 people shows a weak positive correlation between the proportion of Dutch West Indians and percentage of population with at least bachelor's degree education in the United States with a correlation coefficient (R) of 0.243 and weighted average of 28.5%. Similarly, the statistical analysis conducted on geographies consisting of 126,471,941 people shows a weak negative correlation between the proportion of Maltese and percentage of population with at least bachelor's degree education in the United States with a correlation coefficient (R) of -0.279 and weighted average of 41.9%, a difference of 47.0%.
Bachelor's Degree Correlation Summary
| Measurement | Dutch West Indian | Maltese |
| Minimum | 2.6% | 13.5% |
| Maximum | 35.3% | 64.2% |
| Range | 32.6% | 50.8% |
| Mean | 17.5% | 38.1% |
| Median | 16.6% | 40.0% |
| Interquartile 25% (IQ1) | 10.8% | 28.2% |
| Interquartile 75% (IQ3) | 21.5% | 46.4% |
| Interquartile Range (IQR) | 10.7% | 18.3% |
| Standard Deviation (Sample) | 8.7% | 12.6% |
| Standard Deviation (Population) | 8.6% | 12.5% |
Similar Demographics by Bachelor's Degree
Demographics Similar to Dutch West Indians by Bachelor's Degree
In terms of bachelor's degree, the demographic groups most similar to Dutch West Indians are Pennsylvania German (28.4%, a difference of 0.45%), Fijian (28.7%, a difference of 0.71%), Apache (28.3%, a difference of 0.84%), Tsimshian (28.8%, a difference of 0.85%), and Alaskan Athabascan (28.8%, a difference of 1.1%).
| Demographics | Rating | Rank | Bachelor's Degree |
| Colville | 0.0 /100 | #317 | Tragic 29.0% |
| Yaqui | 0.0 /100 | #318 | Tragic 29.0% |
| Creek | 0.0 /100 | #319 | Tragic 28.9% |
| Kiowa | 0.0 /100 | #320 | Tragic 28.8% |
| Alaskan Athabascans | 0.0 /100 | #321 | Tragic 28.8% |
| Tsimshian | 0.0 /100 | #322 | Tragic 28.8% |
| Fijians | 0.0 /100 | #323 | Tragic 28.7% |
| Dutch West Indians | 0.0 /100 | #324 | Tragic 28.5% |
| Pennsylvania Germans | 0.0 /100 | #325 | Tragic 28.4% |
| Apache | 0.0 /100 | #326 | Tragic 28.3% |
| Paiute | 0.0 /100 | #327 | Tragic 28.1% |
| Crow | 0.0 /100 | #328 | Tragic 27.7% |
| Immigrants | Central America | 0.0 /100 | #329 | Tragic 27.5% |
| Spanish American Indians | 0.0 /100 | #330 | Tragic 27.5% |
| Immigrants | Azores | 0.0 /100 | #331 | Tragic 27.3% |
Demographics Similar to Maltese by Bachelor's Degree
In terms of bachelor's degree, the demographic groups most similar to Maltese are Immigrants from Northern Africa (41.9%, a difference of 0.070%), Laotian (42.0%, a difference of 0.17%), Immigrants from Western Europe (42.0%, a difference of 0.30%), Greek (42.0%, a difference of 0.30%), and Carpatho Rusyn (42.1%, a difference of 0.42%).
| Demographics | Rating | Rank | Bachelor's Degree |
| Lithuanians | 99.2 /100 | #85 | Exceptional 42.2% |
| Immigrants | Brazil | 99.2 /100 | #86 | Exceptional 42.2% |
| Carpatho Rusyns | 99.0 /100 | #87 | Exceptional 42.1% |
| Immigrants | Western Europe | 99.0 /100 | #88 | Exceptional 42.0% |
| Greeks | 99.0 /100 | #89 | Exceptional 42.0% |
| Laotians | 98.9 /100 | #90 | Exceptional 42.0% |
| Immigrants | Northern Africa | 98.9 /100 | #91 | Exceptional 41.9% |
| Maltese | 98.8 /100 | #92 | Exceptional 41.9% |
| Immigrants | Canada | 98.6 /100 | #93 | Exceptional 41.7% |
| Immigrants | Nepal | 98.6 /100 | #94 | Exceptional 41.7% |
| Immigrants | North America | 98.5 /100 | #95 | Exceptional 41.7% |
| Immigrants | Moldova | 98.4 /100 | #96 | Exceptional 41.6% |
| Romanians | 98.4 /100 | #97 | Exceptional 41.6% |
| Immigrants | Ukraine | 98.3 /100 | #98 | Exceptional 41.5% |
| Immigrants | England | 98.1 /100 | #99 | Exceptional 41.4% |