Venezuelan vs Immigrants from Belarus 3rd Grade
COMPARE
Venezuelan
Immigrants from Belarus
3rd Grade
3rd Grade Comparison
Venezuelans
Immigrants from Belarus
97.8%
3RD GRADE
60.9/ 100
METRIC RATING
158th/ 347
METRIC RANK
97.7%
3RD GRADE
45.9/ 100
METRIC RATING
179th/ 347
METRIC RANK
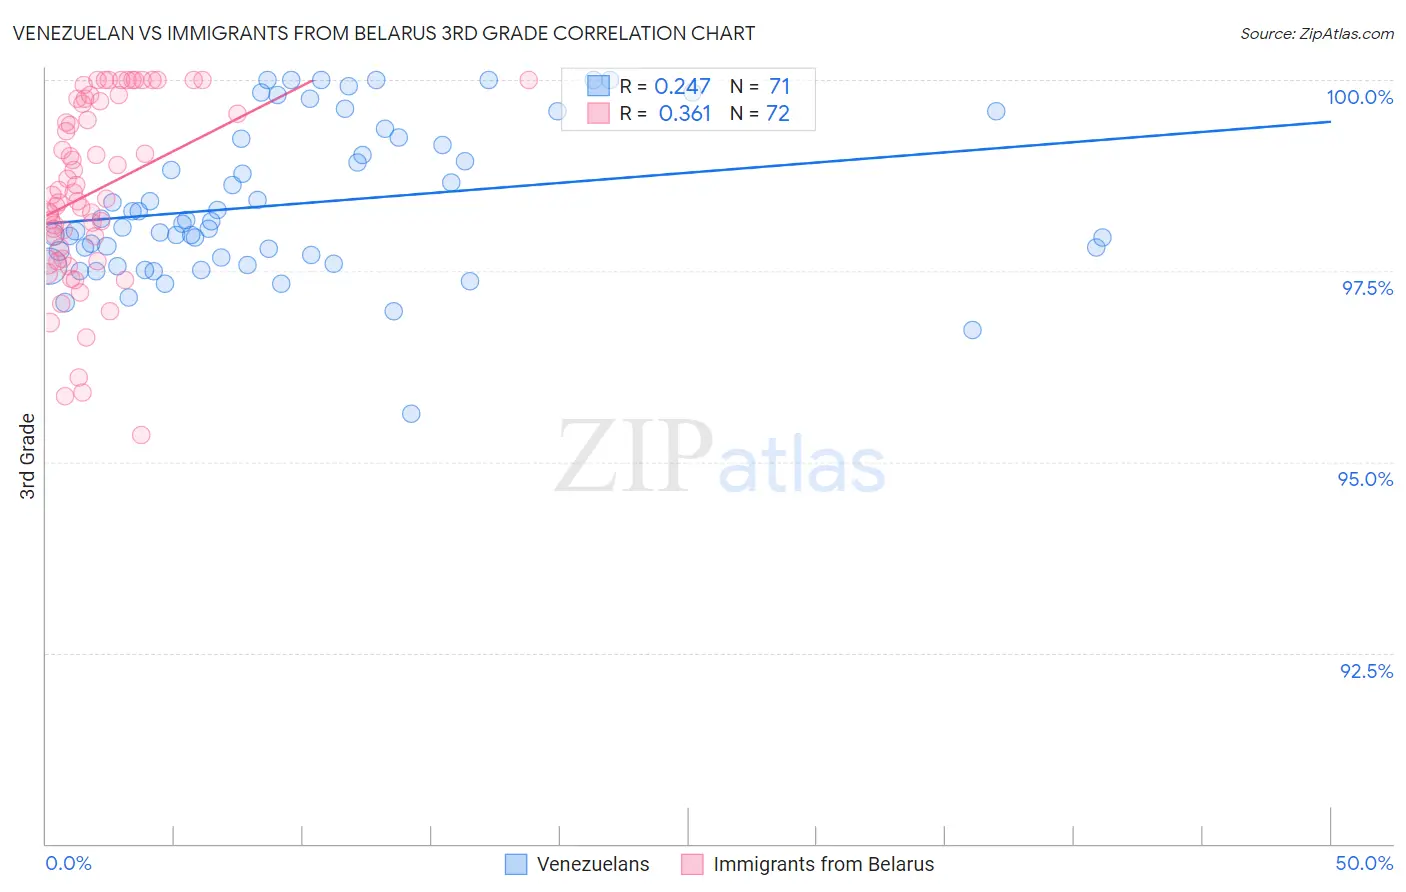
Venezuelan vs Immigrants from Belarus 3rd Grade Correlation Chart
The statistical analysis conducted on geographies consisting of 306,323,638 people shows a weak positive correlation between the proportion of Venezuelans and percentage of population with at least 3rd grade education in the United States with a correlation coefficient (R) of 0.247 and weighted average of 97.8%. Similarly, the statistical analysis conducted on geographies consisting of 149,993,317 people shows a mild positive correlation between the proportion of Immigrants from Belarus and percentage of population with at least 3rd grade education in the United States with a correlation coefficient (R) of 0.361 and weighted average of 97.7%, a difference of 0.050%.
3rd Grade Correlation Summary
| Measurement | Venezuelan | Immigrants from Belarus |
| Minimum | 95.6% | 95.4% |
| Maximum | 100.0% | 100.0% |
| Range | 4.4% | 4.6% |
| Mean | 98.4% | 98.6% |
| Median | 98.1% | 98.5% |
| Interquartile 25% (IQ1) | 97.7% | 97.7% |
| Interquartile 75% (IQ3) | 99.2% | 99.7% |
| Interquartile Range (IQR) | 1.5% | 2.0% |
| Standard Deviation (Sample) | 0.98% | 1.2% |
| Standard Deviation (Population) | 0.98% | 1.2% |
Similar Demographics by 3rd Grade
Demographics Similar to Venezuelans by 3rd Grade
In terms of 3rd grade, the demographic groups most similar to Venezuelans are Immigrants from Russia (97.8%, a difference of 0.0%), Immigrants from Italy (97.8%, a difference of 0.0%), French American Indian (97.8%, a difference of 0.0%), Immigrants from Eastern Europe (97.8%, a difference of 0.010%), and Bermudan (97.8%, a difference of 0.010%).
| Demographics | Rating | Rank | 3rd Grade |
| Soviet Union | 72.6 /100 | #151 | Good 97.8% |
| Immigrants | South Central Asia | 69.5 /100 | #152 | Good 97.8% |
| Apache | 68.5 /100 | #153 | Good 97.8% |
| Immigrants | Eastern Europe | 64.1 /100 | #154 | Good 97.8% |
| Bermudans | 62.6 /100 | #155 | Good 97.8% |
| Immigrants | Russia | 61.7 /100 | #156 | Good 97.8% |
| Immigrants | Italy | 61.2 /100 | #157 | Good 97.8% |
| Venezuelans | 60.9 /100 | #158 | Good 97.8% |
| French American Indians | 60.0 /100 | #159 | Average 97.8% |
| Immigrants | Iran | 59.1 /100 | #160 | Average 97.8% |
| Albanians | 58.8 /100 | #161 | Average 97.8% |
| Immigrants | Jordan | 57.9 /100 | #162 | Average 97.8% |
| Marshallese | 57.2 /100 | #163 | Average 97.8% |
| Immigrants | Bosnia and Herzegovina | 56.2 /100 | #164 | Average 97.8% |
| Ugandans | 56.1 /100 | #165 | Average 97.8% |
Demographics Similar to Immigrants from Belarus by 3rd Grade
In terms of 3rd grade, the demographic groups most similar to Immigrants from Belarus are Immigrants from Poland (97.8%, a difference of 0.0%), Egyptian (97.7%, a difference of 0.0%), Immigrants from Brazil (97.7%, a difference of 0.0%), Immigrants from Sri Lanka (97.7%, a difference of 0.0%), and Navajo (97.8%, a difference of 0.010%).
| Demographics | Rating | Rank | 3rd Grade |
| Spanish Americans | 51.8 /100 | #172 | Average 97.8% |
| Immigrants | Korea | 50.9 /100 | #173 | Average 97.8% |
| Navajo | 50.0 /100 | #174 | Average 97.8% |
| Immigrants | Micronesia | 47.6 /100 | #175 | Average 97.8% |
| Immigrants | Poland | 47.1 /100 | #176 | Average 97.8% |
| Egyptians | 46.6 /100 | #177 | Average 97.7% |
| Immigrants | Brazil | 46.4 /100 | #178 | Average 97.7% |
| Immigrants | Belarus | 45.9 /100 | #179 | Average 97.7% |
| Immigrants | Sri Lanka | 45.1 /100 | #180 | Average 97.7% |
| Immigrants | Venezuela | 44.4 /100 | #181 | Average 97.7% |
| Argentineans | 42.9 /100 | #182 | Average 97.7% |
| Arabs | 40.0 /100 | #183 | Fair 97.7% |
| Immigrants | Kazakhstan | 37.4 /100 | #184 | Fair 97.7% |
| Immigrants | Argentina | 37.0 /100 | #185 | Fair 97.7% |
| Portuguese | 36.2 /100 | #186 | Fair 97.7% |