Venezuelan vs Liberian Kindergarten
COMPARE
Venezuelan
Liberian
Kindergarten
Kindergarten Comparison
Venezuelans
Liberians
98.0%
KINDERGARTEN
64.7/ 100
METRIC RATING
158th/ 347
METRIC RANK
97.6%
KINDERGARTEN
1.3/ 100
METRIC RATING
241st/ 347
METRIC RANK
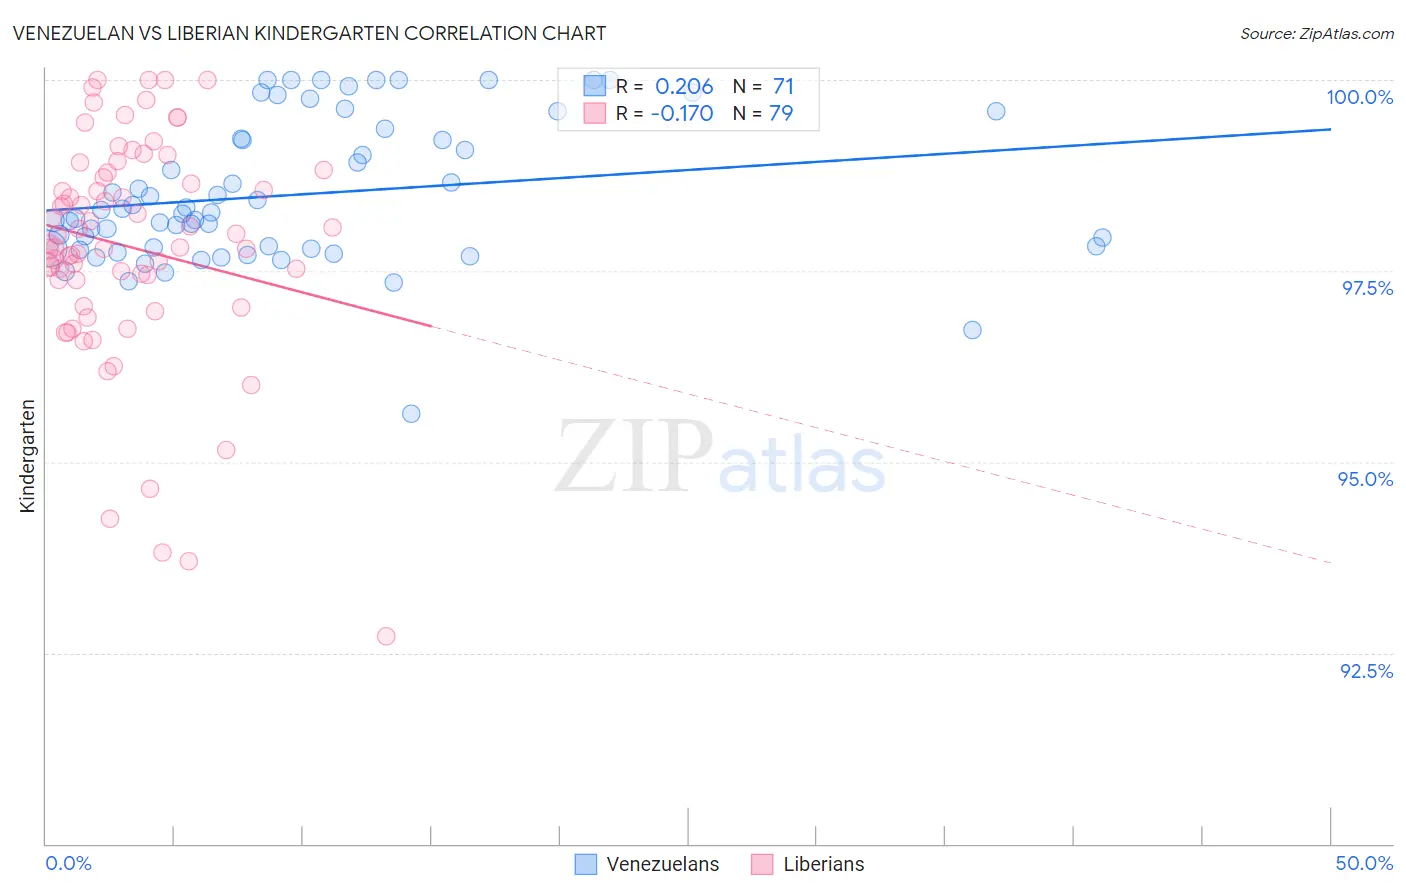
Venezuelan vs Liberian Kindergarten Correlation Chart
The statistical analysis conducted on geographies consisting of 306,323,638 people shows a weak positive correlation between the proportion of Venezuelans and percentage of population with at least kindergarten education in the United States with a correlation coefficient (R) of 0.206 and weighted average of 98.0%. Similarly, the statistical analysis conducted on geographies consisting of 118,100,194 people shows a poor negative correlation between the proportion of Liberians and percentage of population with at least kindergarten education in the United States with a correlation coefficient (R) of -0.170 and weighted average of 97.6%, a difference of 0.38%.
Kindergarten Correlation Summary
| Measurement | Venezuelan | Liberian |
| Minimum | 95.6% | 92.7% |
| Maximum | 100.0% | 100.0% |
| Range | 4.4% | 7.3% |
| Mean | 98.5% | 97.8% |
| Median | 98.3% | 97.9% |
| Interquartile 25% (IQ1) | 97.8% | 97.4% |
| Interquartile 75% (IQ3) | 99.2% | 98.8% |
| Interquartile Range (IQR) | 1.4% | 1.4% |
| Standard Deviation (Sample) | 0.94% | 1.5% |
| Standard Deviation (Population) | 0.93% | 1.5% |
Similar Demographics by Kindergarten
Demographics Similar to Venezuelans by Kindergarten
In terms of kindergarten, the demographic groups most similar to Venezuelans are French American Indian (98.0%, a difference of 0.0%), Immigrants from Iran (98.0%, a difference of 0.010%), Comanche (98.0%, a difference of 0.010%), Immigrants from South Central Asia (98.0%, a difference of 0.010%), and Immigrants from North Macedonia (98.0%, a difference of 0.010%).
| Demographics | Rating | Rank | Kindergarten |
| Soviet Union | 70.8 /100 | #151 | Good 98.0% |
| Dutch West Indians | 70.1 /100 | #152 | Good 98.0% |
| Immigrants | Moldova | 69.1 /100 | #153 | Good 98.0% |
| Immigrants | Iran | 68.8 /100 | #154 | Good 98.0% |
| Comanche | 68.3 /100 | #155 | Good 98.0% |
| Immigrants | South Central Asia | 66.6 /100 | #156 | Good 98.0% |
| Immigrants | North Macedonia | 66.4 /100 | #157 | Good 98.0% |
| Venezuelans | 64.7 /100 | #158 | Good 98.0% |
| French American Indians | 63.7 /100 | #159 | Good 98.0% |
| Immigrants | Russia | 59.0 /100 | #160 | Average 98.0% |
| Immigrants | Eastern Europe | 59.0 /100 | #161 | Average 98.0% |
| Immigrants | Italy | 58.9 /100 | #162 | Average 98.0% |
| Spanish Americans | 57.8 /100 | #163 | Average 98.0% |
| Immigrants | Micronesia | 57.7 /100 | #164 | Average 98.0% |
| Ugandans | 56.9 /100 | #165 | Average 98.0% |
Demographics Similar to Liberians by Kindergarten
In terms of kindergarten, the demographic groups most similar to Liberians are Immigrants from Indonesia (97.6%, a difference of 0.0%), Asian (97.6%, a difference of 0.010%), Bolivian (97.6%, a difference of 0.010%), South American (97.6%, a difference of 0.010%), and Immigrants from Eastern Asia (97.6%, a difference of 0.020%).
| Demographics | Rating | Rank | Kindergarten |
| Immigrants | Malaysia | 2.2 /100 | #234 | Tragic 97.7% |
| Colombians | 2.2 /100 | #235 | Tragic 97.7% |
| Immigrants | Western Asia | 2.1 /100 | #236 | Tragic 97.7% |
| Nigerians | 1.8 /100 | #237 | Tragic 97.6% |
| Immigrants | Eastern Asia | 1.7 /100 | #238 | Tragic 97.6% |
| U.S. Virgin Islanders | 1.7 /100 | #239 | Tragic 97.6% |
| Koreans | 1.6 /100 | #240 | Tragic 97.6% |
| Liberians | 1.3 /100 | #241 | Tragic 97.6% |
| Immigrants | Indonesia | 1.3 /100 | #242 | Tragic 97.6% |
| Asians | 1.2 /100 | #243 | Tragic 97.6% |
| Bolivians | 1.2 /100 | #244 | Tragic 97.6% |
| South Americans | 1.1 /100 | #245 | Tragic 97.6% |
| Indians (Asian) | 1.0 /100 | #246 | Tragic 97.6% |
| Immigrants | Eastern Africa | 1.0 /100 | #247 | Tragic 97.6% |
| Immigrants | Middle Africa | 1.0 /100 | #248 | Tragic 97.6% |