Venezuelan vs Pima No Schooling Completed
COMPARE
Venezuelan
Pima
No Schooling Completed
No Schooling Completed Comparison
Venezuelans
Pima
2.0%
NO SCHOOLING COMPLETED
81.5/ 100
METRIC RATING
142nd/ 347
METRIC RANK
2.1%
NO SCHOOLING COMPLETED
41.3/ 100
METRIC RATING
184th/ 347
METRIC RANK
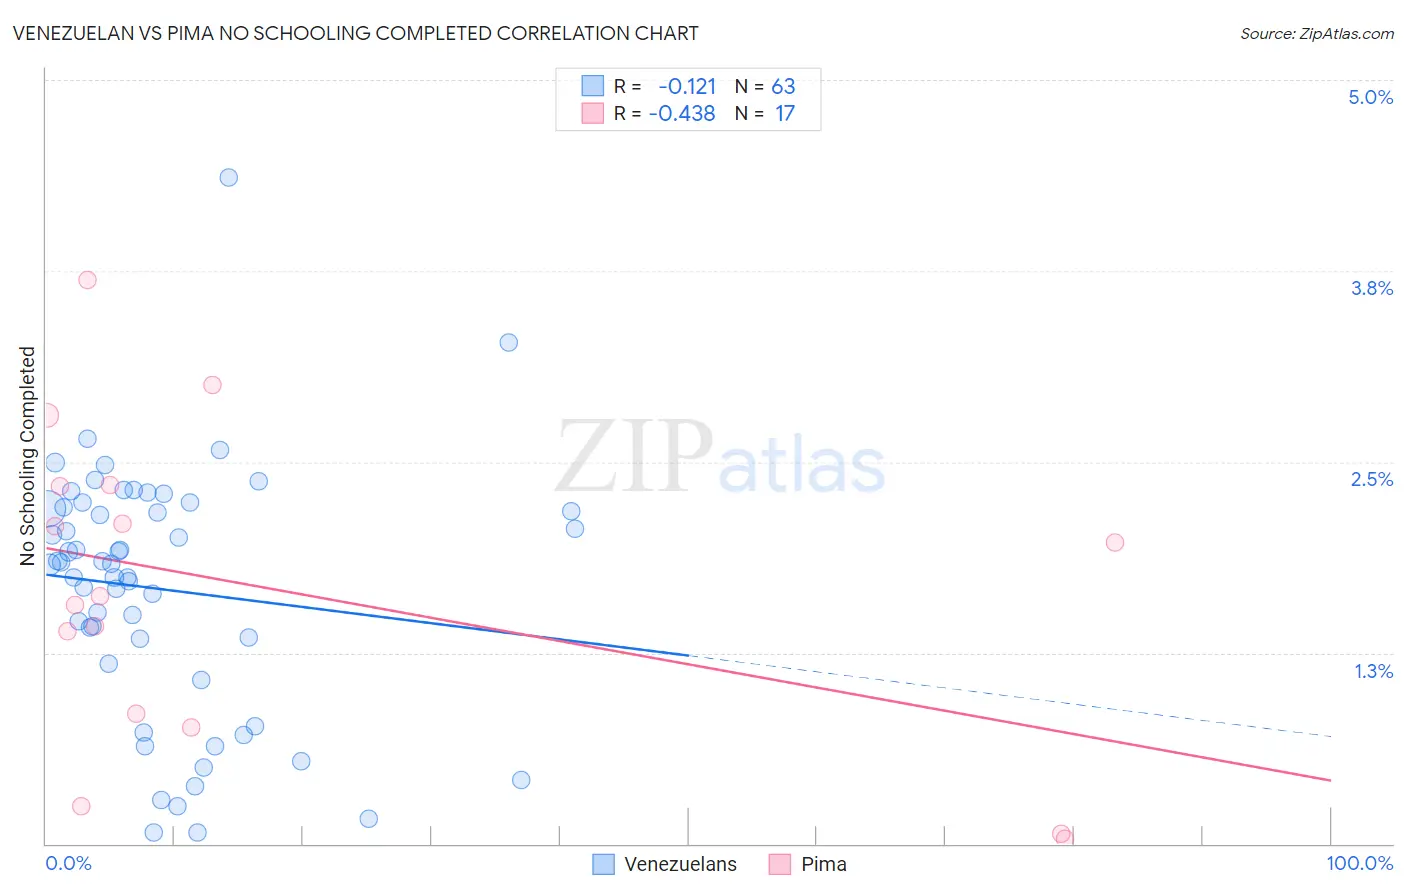
Venezuelan vs Pima No Schooling Completed Correlation Chart
The statistical analysis conducted on geographies consisting of 304,404,402 people shows a poor negative correlation between the proportion of Venezuelans and percentage of population with no schooling in the United States with a correlation coefficient (R) of -0.121 and weighted average of 2.0%. Similarly, the statistical analysis conducted on geographies consisting of 61,416,926 people shows a moderate negative correlation between the proportion of Pima and percentage of population with no schooling in the United States with a correlation coefficient (R) of -0.438 and weighted average of 2.1%, a difference of 6.5%.
No Schooling Completed Correlation Summary
| Measurement | Venezuelan | Pima |
| Minimum | 0.072% | 0.035% |
| Maximum | 4.4% | 3.7% |
| Range | 4.3% | 3.7% |
| Mean | 1.7% | 1.7% |
| Median | 1.8% | 1.6% |
| Interquartile 25% (IQ1) | 1.2% | 0.80% |
| Interquartile 75% (IQ3) | 2.2% | 2.3% |
| Interquartile Range (IQR) | 1.0% | 1.5% |
| Standard Deviation (Sample) | 0.82% | 1.0% |
| Standard Deviation (Population) | 0.81% | 1.0% |
Similar Demographics by No Schooling Completed
Demographics Similar to Venezuelans by No Schooling Completed
In terms of no schooling completed, the demographic groups most similar to Venezuelans are Immigrants from South Central Asia (2.0%, a difference of 0.35%), Immigrants from Greece (2.0%, a difference of 0.49%), Marshallese (2.0%, a difference of 0.50%), Alsatian (2.0%, a difference of 0.55%), and Immigrants from Iran (2.0%, a difference of 0.55%).
| Demographics | Rating | Rank | No Schooling Completed |
| Hmong | 88.5 /100 | #135 | Excellent 1.9% |
| Burmese | 88.2 /100 | #136 | Excellent 1.9% |
| Filipinos | 85.5 /100 | #137 | Excellent 2.0% |
| Immigrants | Israel | 85.4 /100 | #138 | Excellent 2.0% |
| Jordanians | 84.5 /100 | #139 | Excellent 2.0% |
| Marshallese | 83.5 /100 | #140 | Excellent 2.0% |
| Immigrants | Greece | 83.5 /100 | #141 | Excellent 2.0% |
| Venezuelans | 81.5 /100 | #142 | Excellent 2.0% |
| Immigrants | South Central Asia | 80.0 /100 | #143 | Good 2.0% |
| Alsatians | 79.1 /100 | #144 | Good 2.0% |
| Immigrants | Iran | 79.0 /100 | #145 | Good 2.0% |
| Immigrants | Moldova | 78.0 /100 | #146 | Good 2.0% |
| Soviet Union | 77.1 /100 | #147 | Good 2.0% |
| Shoshone | 76.7 /100 | #148 | Good 2.0% |
| Immigrants | North Macedonia | 75.9 /100 | #149 | Good 2.0% |
Demographics Similar to Pima by No Schooling Completed
In terms of no schooling completed, the demographic groups most similar to Pima are Black/African American (2.1%, a difference of 0.020%), Mongolian (2.1%, a difference of 0.070%), French American Indian (2.1%, a difference of 0.12%), Immigrants from Taiwan (2.1%, a difference of 0.17%), and Portuguese (2.1%, a difference of 0.35%).
| Demographics | Rating | Rank | No Schooling Completed |
| Arapaho | 45.0 /100 | #177 | Average 2.1% |
| Pakistanis | 44.7 /100 | #178 | Average 2.1% |
| Immigrants | Kazakhstan | 44.3 /100 | #179 | Average 2.1% |
| Portuguese | 43.9 /100 | #180 | Average 2.1% |
| Immigrants | Taiwan | 42.6 /100 | #181 | Average 2.1% |
| French American Indians | 42.2 /100 | #182 | Average 2.1% |
| Blacks/African Americans | 41.4 /100 | #183 | Average 2.1% |
| Pima | 41.3 /100 | #184 | Average 2.1% |
| Mongolians | 40.8 /100 | #185 | Average 2.1% |
| Immigrants | Bosnia and Herzegovina | 38.6 /100 | #186 | Fair 2.1% |
| Navajo | 36.5 /100 | #187 | Fair 2.1% |
| Immigrants | Kenya | 36.2 /100 | #188 | Fair 2.1% |
| Immigrants | Egypt | 36.1 /100 | #189 | Fair 2.1% |
| Spanish Americans | 32.6 /100 | #190 | Fair 2.1% |
| Bermudans | 30.7 /100 | #191 | Fair 2.1% |