Venezuelan vs Immigrants from Northern Africa No Schooling Completed
COMPARE
Venezuelan
Immigrants from Northern Africa
No Schooling Completed
No Schooling Completed Comparison
Venezuelans
Immigrants from Northern Africa
2.0%
NO SCHOOLING COMPLETED
81.5/ 100
METRIC RATING
142nd/ 347
METRIC RANK
2.2%
NO SCHOOLING COMPLETED
19.5/ 100
METRIC RATING
200th/ 347
METRIC RANK
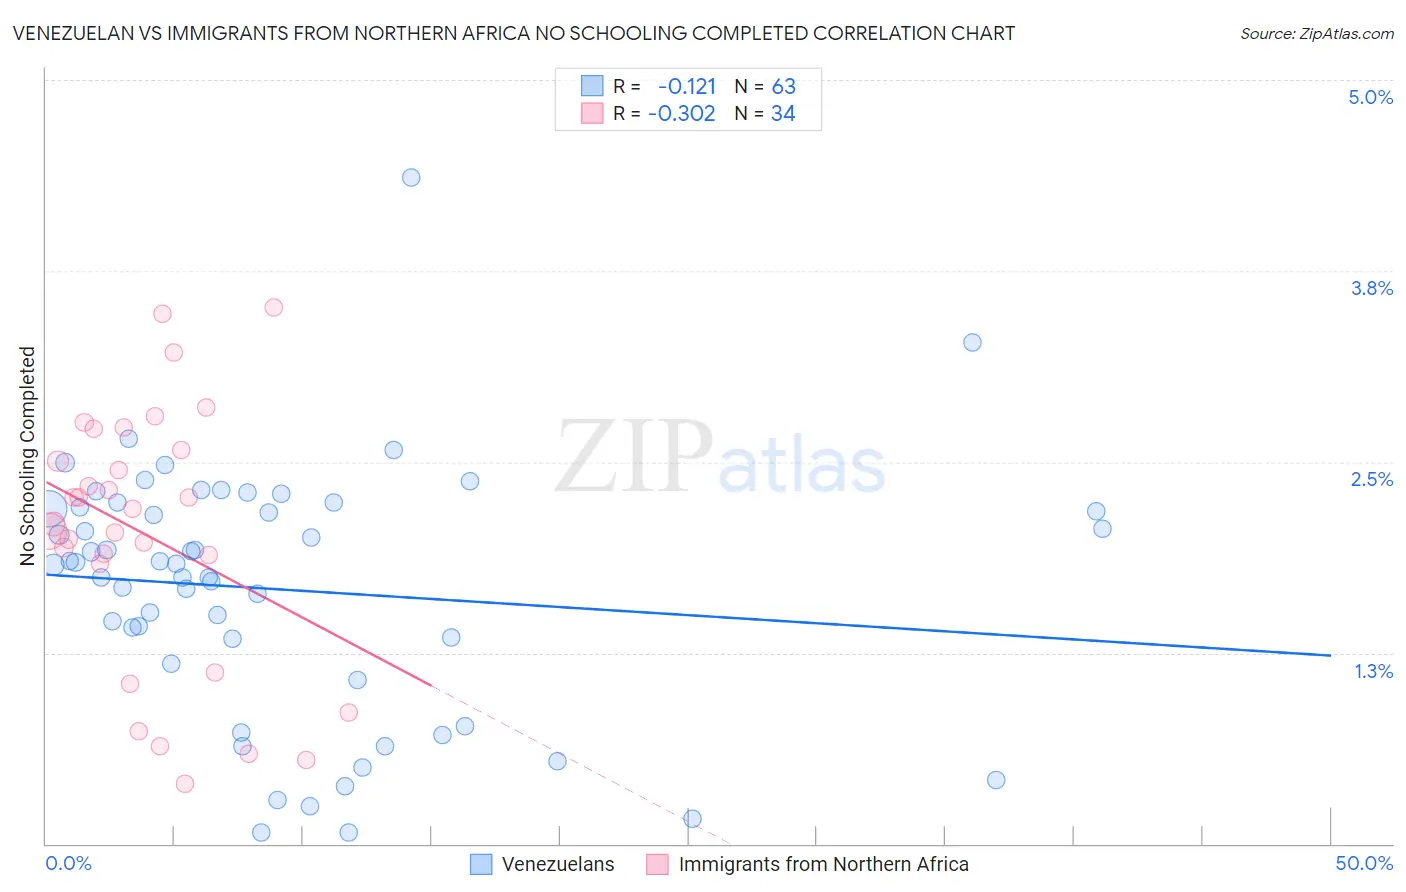
Venezuelan vs Immigrants from Northern Africa No Schooling Completed Correlation Chart
The statistical analysis conducted on geographies consisting of 304,404,402 people shows a poor negative correlation between the proportion of Venezuelans and percentage of population with no schooling in the United States with a correlation coefficient (R) of -0.121 and weighted average of 2.0%. Similarly, the statistical analysis conducted on geographies consisting of 319,330,485 people shows a mild negative correlation between the proportion of Immigrants from Northern Africa and percentage of population with no schooling in the United States with a correlation coefficient (R) of -0.302 and weighted average of 2.2%, a difference of 10.3%.
No Schooling Completed Correlation Summary
| Measurement | Venezuelan | Immigrants from Northern Africa |
| Minimum | 0.072% | 0.40% |
| Maximum | 4.4% | 3.5% |
| Range | 4.3% | 3.1% |
| Mean | 1.7% | 2.0% |
| Median | 1.8% | 2.1% |
| Interquartile 25% (IQ1) | 1.2% | 1.8% |
| Interquartile 75% (IQ3) | 2.2% | 2.6% |
| Interquartile Range (IQR) | 1.0% | 0.74% |
| Standard Deviation (Sample) | 0.82% | 0.84% |
| Standard Deviation (Population) | 0.81% | 0.83% |
Similar Demographics by No Schooling Completed
Demographics Similar to Venezuelans by No Schooling Completed
In terms of no schooling completed, the demographic groups most similar to Venezuelans are Immigrants from South Central Asia (2.0%, a difference of 0.35%), Immigrants from Greece (2.0%, a difference of 0.49%), Marshallese (2.0%, a difference of 0.50%), Alsatian (2.0%, a difference of 0.55%), and Immigrants from Iran (2.0%, a difference of 0.55%).
| Demographics | Rating | Rank | No Schooling Completed |
| Hmong | 88.5 /100 | #135 | Excellent 1.9% |
| Burmese | 88.2 /100 | #136 | Excellent 1.9% |
| Filipinos | 85.5 /100 | #137 | Excellent 2.0% |
| Immigrants | Israel | 85.4 /100 | #138 | Excellent 2.0% |
| Jordanians | 84.5 /100 | #139 | Excellent 2.0% |
| Marshallese | 83.5 /100 | #140 | Excellent 2.0% |
| Immigrants | Greece | 83.5 /100 | #141 | Excellent 2.0% |
| Venezuelans | 81.5 /100 | #142 | Excellent 2.0% |
| Immigrants | South Central Asia | 80.0 /100 | #143 | Good 2.0% |
| Alsatians | 79.1 /100 | #144 | Good 2.0% |
| Immigrants | Iran | 79.0 /100 | #145 | Good 2.0% |
| Immigrants | Moldova | 78.0 /100 | #146 | Good 2.0% |
| Soviet Union | 77.1 /100 | #147 | Good 2.0% |
| Shoshone | 76.7 /100 | #148 | Good 2.0% |
| Immigrants | North Macedonia | 75.9 /100 | #149 | Good 2.0% |
Demographics Similar to Immigrants from Northern Africa by No Schooling Completed
In terms of no schooling completed, the demographic groups most similar to Immigrants from Northern Africa are African (2.2%, a difference of 0.46%), Costa Rican (2.2%, a difference of 0.52%), Immigrants from Chile (2.2%, a difference of 0.64%), Immigrants from Southern Europe (2.2%, a difference of 0.82%), and Immigrants from Ukraine (2.2%, a difference of 1.2%).
| Demographics | Rating | Rank | No Schooling Completed |
| Paraguayans | 29.3 /100 | #193 | Fair 2.2% |
| Immigrants | Albania | 28.3 /100 | #194 | Fair 2.2% |
| Hawaiians | 27.0 /100 | #195 | Fair 2.2% |
| Immigrants | Ukraine | 26.1 /100 | #196 | Fair 2.2% |
| Immigrants | Southern Europe | 23.8 /100 | #197 | Fair 2.2% |
| Immigrants | Chile | 22.7 /100 | #198 | Fair 2.2% |
| Africans | 21.8 /100 | #199 | Fair 2.2% |
| Immigrants | Northern Africa | 19.5 /100 | #200 | Poor 2.2% |
| Costa Ricans | 17.1 /100 | #201 | Poor 2.2% |
| Moroccans | 13.7 /100 | #202 | Poor 2.2% |
| Laotians | 13.3 /100 | #203 | Poor 2.2% |
| Hopi | 12.9 /100 | #204 | Poor 2.2% |
| Immigrants | Bahamas | 11.6 /100 | #205 | Poor 2.2% |
| Bahamians | 11.6 /100 | #206 | Poor 2.2% |
| South American Indians | 11.0 /100 | #207 | Poor 2.2% |