Venezuelan vs Ute No Schooling Completed
COMPARE
Venezuelan
Ute
No Schooling Completed
No Schooling Completed Comparison
Venezuelans
Ute
2.0%
NO SCHOOLING COMPLETED
81.5/ 100
METRIC RATING
142nd/ 347
METRIC RANK
2.3%
NO SCHOOLING COMPLETED
8.2/ 100
METRIC RATING
213th/ 347
METRIC RANK
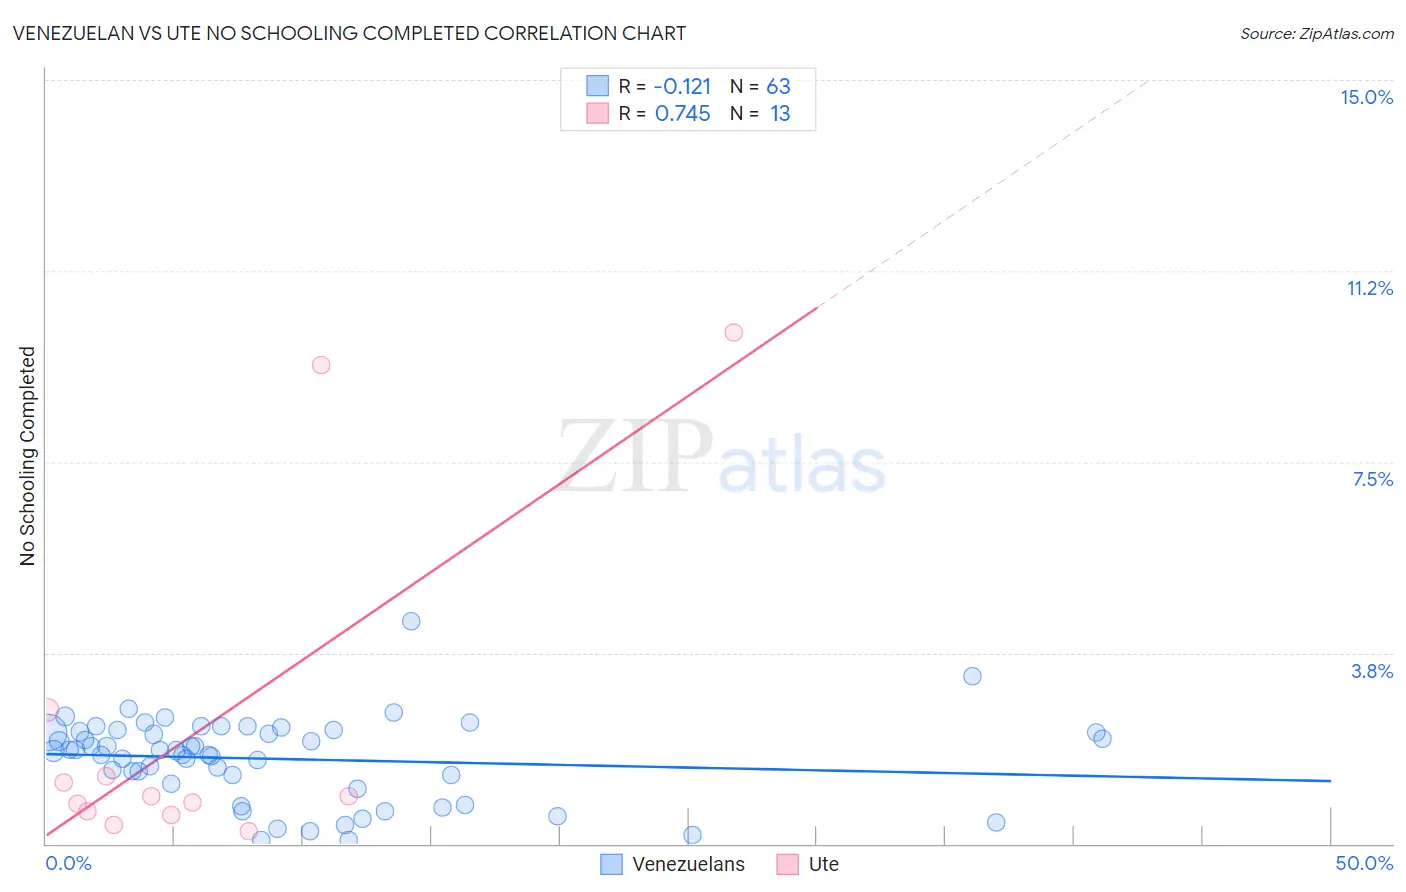
Venezuelan vs Ute No Schooling Completed Correlation Chart
The statistical analysis conducted on geographies consisting of 304,404,402 people shows a poor negative correlation between the proportion of Venezuelans and percentage of population with no schooling in the United States with a correlation coefficient (R) of -0.121 and weighted average of 2.0%. Similarly, the statistical analysis conducted on geographies consisting of 55,448,088 people shows a strong positive correlation between the proportion of Ute and percentage of population with no schooling in the United States with a correlation coefficient (R) of 0.745 and weighted average of 2.3%, a difference of 13.8%.
No Schooling Completed Correlation Summary
| Measurement | Venezuelan | Ute |
| Minimum | 0.072% | 0.24% |
| Maximum | 4.4% | 10.1% |
| Range | 4.3% | 9.8% |
| Mean | 1.7% | 2.3% |
| Median | 1.8% | 0.92% |
| Interquartile 25% (IQ1) | 1.2% | 0.61% |
| Interquartile 75% (IQ3) | 2.2% | 2.0% |
| Interquartile Range (IQR) | 1.0% | 1.4% |
| Standard Deviation (Sample) | 0.82% | 3.4% |
| Standard Deviation (Population) | 0.81% | 3.2% |
Similar Demographics by No Schooling Completed
Demographics Similar to Venezuelans by No Schooling Completed
In terms of no schooling completed, the demographic groups most similar to Venezuelans are Immigrants from South Central Asia (2.0%, a difference of 0.35%), Immigrants from Greece (2.0%, a difference of 0.49%), Marshallese (2.0%, a difference of 0.50%), Alsatian (2.0%, a difference of 0.55%), and Immigrants from Iran (2.0%, a difference of 0.55%).
| Demographics | Rating | Rank | No Schooling Completed |
| Hmong | 88.5 /100 | #135 | Excellent 1.9% |
| Burmese | 88.2 /100 | #136 | Excellent 1.9% |
| Filipinos | 85.5 /100 | #137 | Excellent 2.0% |
| Immigrants | Israel | 85.4 /100 | #138 | Excellent 2.0% |
| Jordanians | 84.5 /100 | #139 | Excellent 2.0% |
| Marshallese | 83.5 /100 | #140 | Excellent 2.0% |
| Immigrants | Greece | 83.5 /100 | #141 | Excellent 2.0% |
| Venezuelans | 81.5 /100 | #142 | Excellent 2.0% |
| Immigrants | South Central Asia | 80.0 /100 | #143 | Good 2.0% |
| Alsatians | 79.1 /100 | #144 | Good 2.0% |
| Immigrants | Iran | 79.0 /100 | #145 | Good 2.0% |
| Immigrants | Moldova | 78.0 /100 | #146 | Good 2.0% |
| Soviet Union | 77.1 /100 | #147 | Good 2.0% |
| Shoshone | 76.7 /100 | #148 | Good 2.0% |
| Immigrants | North Macedonia | 75.9 /100 | #149 | Good 2.0% |
Demographics Similar to Ute by No Schooling Completed
In terms of no schooling completed, the demographic groups most similar to Ute are Samoan (2.3%, a difference of 0.040%), Immigrants from Morocco (2.3%, a difference of 0.19%), Immigrants from Panama (2.3%, a difference of 0.20%), Immigrants from Zaire (2.3%, a difference of 0.47%), and Native/Alaskan (2.2%, a difference of 0.66%).
| Demographics | Rating | Rank | No Schooling Completed |
| Bahamians | 11.6 /100 | #206 | Poor 2.2% |
| South American Indians | 11.0 /100 | #207 | Poor 2.2% |
| Uruguayans | 11.0 /100 | #208 | Poor 2.2% |
| Immigrants | Oceania | 10.2 /100 | #209 | Poor 2.2% |
| Natives/Alaskans | 10.0 /100 | #210 | Tragic 2.2% |
| Immigrants | Panama | 8.8 /100 | #211 | Tragic 2.3% |
| Immigrants | Morocco | 8.7 /100 | #212 | Tragic 2.3% |
| Ute | 8.2 /100 | #213 | Tragic 2.3% |
| Samoans | 8.2 /100 | #214 | Tragic 2.3% |
| Immigrants | Zaire | 7.2 /100 | #215 | Tragic 2.3% |
| Tongans | 6.8 /100 | #216 | Tragic 2.3% |
| Immigrants | Syria | 6.6 /100 | #217 | Tragic 2.3% |
| Immigrants | Nepal | 6.4 /100 | #218 | Tragic 2.3% |
| Senegalese | 5.6 /100 | #219 | Tragic 2.3% |
| Immigrants | Costa Rica | 5.1 /100 | #220 | Tragic 2.3% |