Ute vs Ugandan Seniors Poverty Over the Age of 75
COMPARE
Ute
Ugandan
Seniors Poverty Over the Age of 75
Seniors Poverty Over the Age of 75 Comparison
Ute
Ugandans
12.9%
SENIORS POVERTY OVER THE AGE OF 75
4.7/ 100
METRIC RATING
219th/ 347
METRIC RANK
11.9%
SENIORS POVERTY OVER THE AGE OF 75
77.1/ 100
METRIC RATING
134th/ 347
METRIC RANK
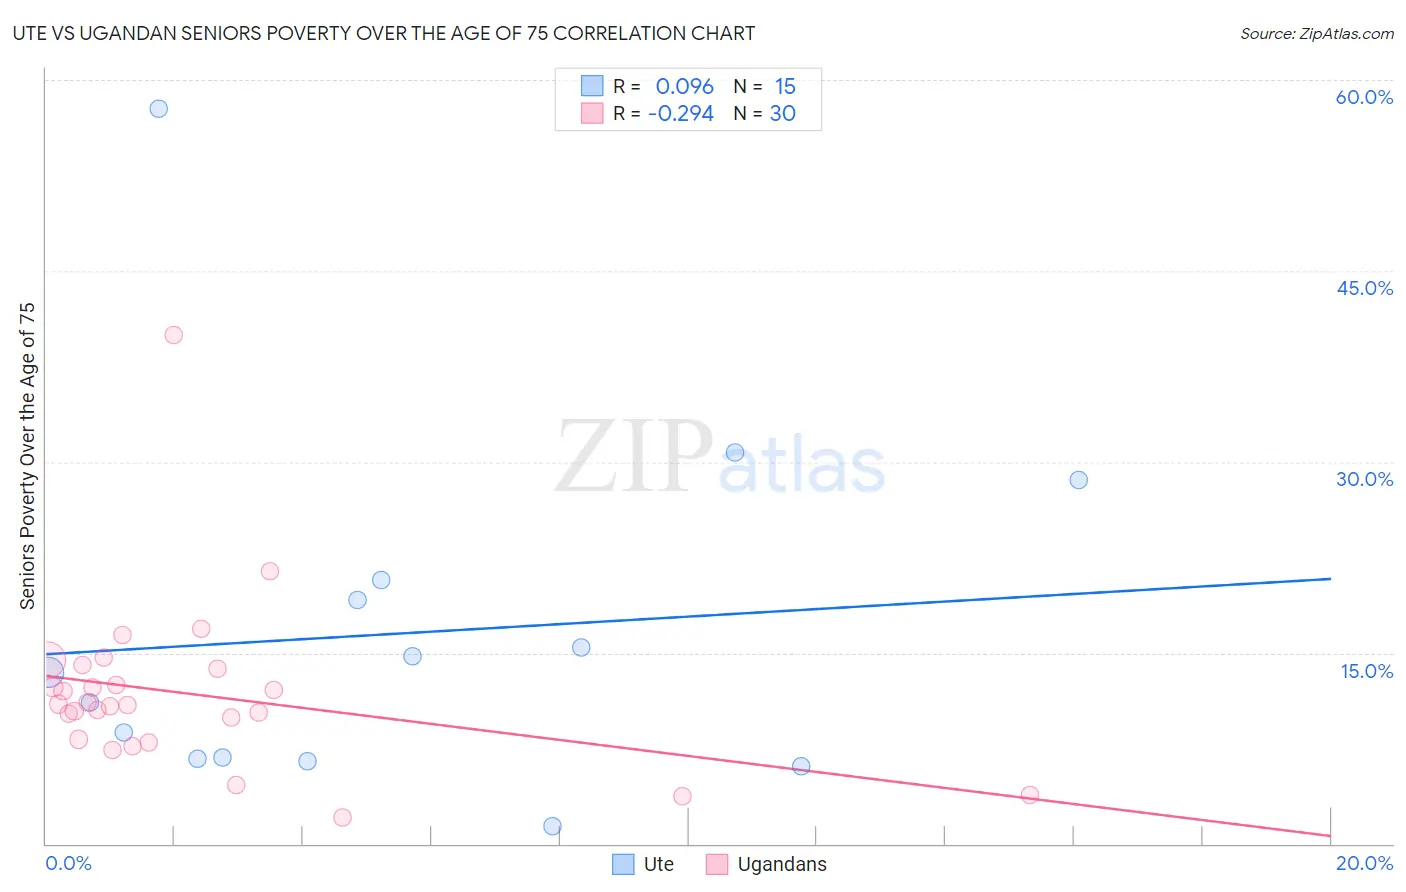
Ute vs Ugandan Seniors Poverty Over the Age of 75 Correlation Chart
The statistical analysis conducted on geographies consisting of 55,367,939 people shows a slight positive correlation between the proportion of Ute and poverty level among seniors over the age of 75 in the United States with a correlation coefficient (R) of 0.096 and weighted average of 12.9%. Similarly, the statistical analysis conducted on geographies consisting of 93,703,303 people shows a weak negative correlation between the proportion of Ugandans and poverty level among seniors over the age of 75 in the United States with a correlation coefficient (R) of -0.294 and weighted average of 11.9%, a difference of 8.8%.
Seniors Poverty Over the Age of 75 Correlation Summary
| Measurement | Ute | Ugandan |
| Minimum | 1.4% | 2.1% |
| Maximum | 57.8% | 40.0% |
| Range | 56.4% | 37.9% |
| Mean | 16.5% | 11.8% |
| Median | 13.5% | 10.9% |
| Interquartile 25% (IQ1) | 6.7% | 8.2% |
| Interquartile 75% (IQ3) | 20.8% | 13.8% |
| Interquartile Range (IQR) | 14.1% | 5.5% |
| Standard Deviation (Sample) | 14.2% | 6.7% |
| Standard Deviation (Population) | 13.7% | 6.6% |
Similar Demographics by Seniors Poverty Over the Age of 75
Demographics Similar to Ute by Seniors Poverty Over the Age of 75
In terms of seniors poverty over the age of 75, the demographic groups most similar to Ute are Immigrants from Western Asia (12.9%, a difference of 0.060%), Bermudan (12.9%, a difference of 0.090%), Seminole (12.9%, a difference of 0.11%), Immigrants from Brazil (12.9%, a difference of 0.18%), and Immigrants from Kazakhstan (13.0%, a difference of 0.20%).
| Demographics | Rating | Rank | Seniors Poverty Over the Age of 75 |
| Immigrants | Hong Kong | 6.5 /100 | #212 | Tragic 12.8% |
| French American Indians | 6.1 /100 | #213 | Tragic 12.9% |
| Immigrants | Africa | 5.9 /100 | #214 | Tragic 12.9% |
| South American Indians | 5.5 /100 | #215 | Tragic 12.9% |
| Immigrants | Brazil | 5.2 /100 | #216 | Tragic 12.9% |
| Bermudans | 4.9 /100 | #217 | Tragic 12.9% |
| Immigrants | Western Asia | 4.9 /100 | #218 | Tragic 12.9% |
| Ute | 4.7 /100 | #219 | Tragic 12.9% |
| Seminole | 4.5 /100 | #220 | Tragic 12.9% |
| Immigrants | Kazakhstan | 4.3 /100 | #221 | Tragic 13.0% |
| Nigerians | 3.4 /100 | #222 | Tragic 13.0% |
| Immigrants | Nigeria | 3.3 /100 | #223 | Tragic 13.0% |
| Chippewa | 2.9 /100 | #224 | Tragic 13.1% |
| Immigrants | Morocco | 2.8 /100 | #225 | Tragic 13.1% |
| Shoshone | 2.6 /100 | #226 | Tragic 13.1% |
Demographics Similar to Ugandans by Seniors Poverty Over the Age of 75
In terms of seniors poverty over the age of 75, the demographic groups most similar to Ugandans are Immigrants from Sierra Leone (11.9%, a difference of 0.060%), Immigrants from Ireland (11.9%, a difference of 0.10%), Lebanese (11.9%, a difference of 0.15%), Immigrants from Philippines (11.9%, a difference of 0.24%), and Immigrants from Western Europe (11.9%, a difference of 0.31%).
| Demographics | Rating | Rank | Seniors Poverty Over the Age of 75 |
| Immigrants | Denmark | 82.6 /100 | #127 | Excellent 11.8% |
| Immigrants | Hungary | 81.7 /100 | #128 | Excellent 11.8% |
| Ethiopians | 80.7 /100 | #129 | Excellent 11.8% |
| Spanish | 80.5 /100 | #130 | Excellent 11.8% |
| Immigrants | Western Europe | 79.6 /100 | #131 | Good 11.9% |
| Lebanese | 78.3 /100 | #132 | Good 11.9% |
| Immigrants | Sierra Leone | 77.6 /100 | #133 | Good 11.9% |
| Ugandans | 77.1 /100 | #134 | Good 11.9% |
| Immigrants | Ireland | 76.2 /100 | #135 | Good 11.9% |
| Immigrants | Philippines | 75.0 /100 | #136 | Good 11.9% |
| Immigrants | Moldova | 74.1 /100 | #137 | Good 11.9% |
| Immigrants | Romania | 72.6 /100 | #138 | Good 11.9% |
| Immigrants | Kenya | 72.6 /100 | #139 | Good 11.9% |
| Immigrants | Pakistan | 71.9 /100 | #140 | Good 12.0% |
| Immigrants | Cameroon | 71.7 /100 | #141 | Good 12.0% |