Ute vs Shoshone No Schooling Completed
COMPARE
Ute
Shoshone
No Schooling Completed
No Schooling Completed Comparison
Ute
Shoshone
2.3%
NO SCHOOLING COMPLETED
8.2/ 100
METRIC RATING
213th/ 347
METRIC RANK
2.0%
NO SCHOOLING COMPLETED
76.7/ 100
METRIC RATING
148th/ 347
METRIC RANK
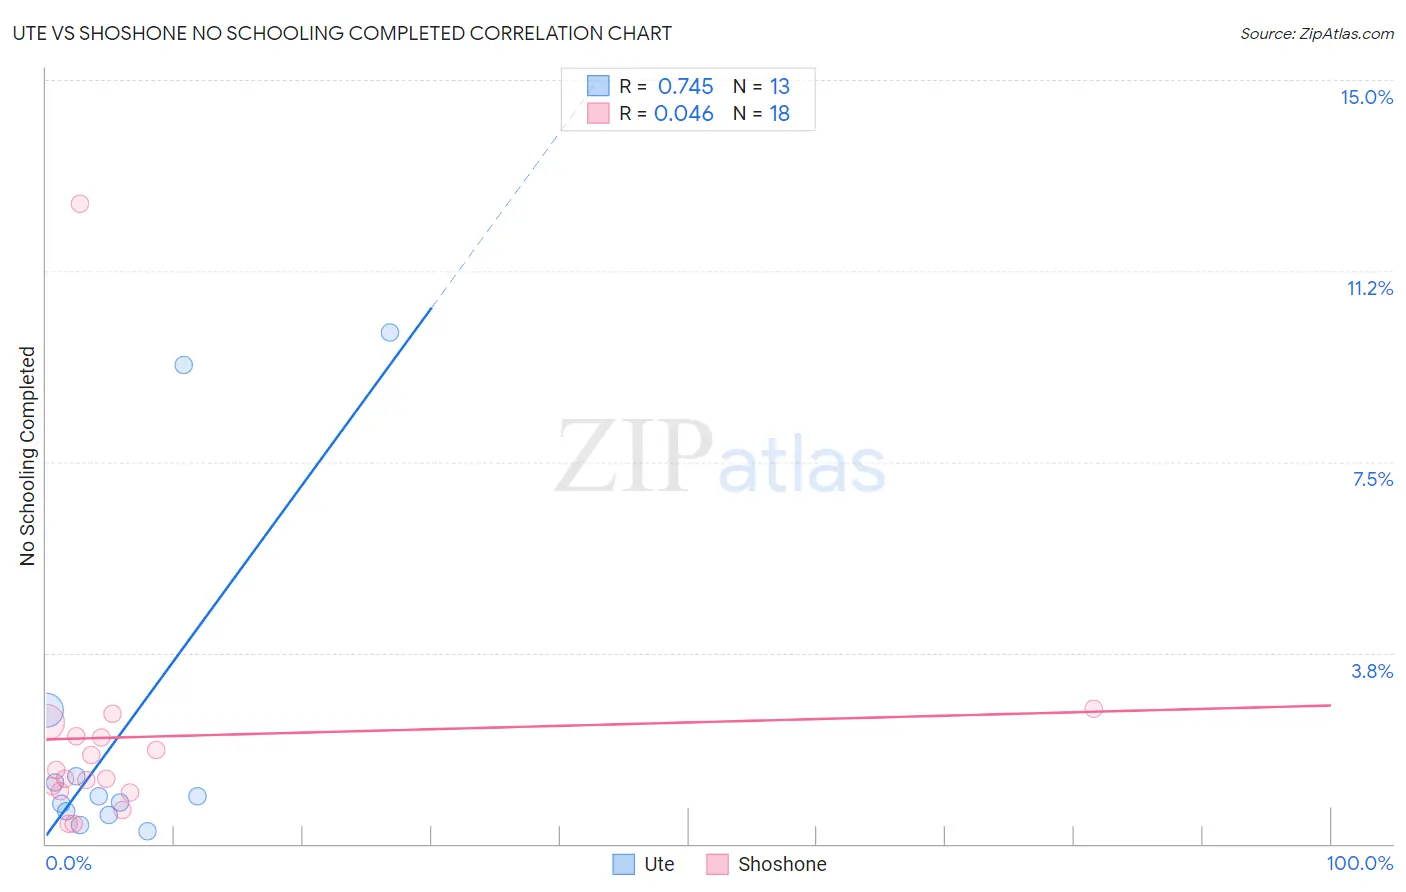
Ute vs Shoshone No Schooling Completed Correlation Chart
The statistical analysis conducted on geographies consisting of 55,448,088 people shows a strong positive correlation between the proportion of Ute and percentage of population with no schooling in the United States with a correlation coefficient (R) of 0.745 and weighted average of 2.3%. Similarly, the statistical analysis conducted on geographies consisting of 66,330,496 people shows no correlation between the proportion of Shoshone and percentage of population with no schooling in the United States with a correlation coefficient (R) of 0.046 and weighted average of 2.0%, a difference of 12.6%.
No Schooling Completed Correlation Summary
| Measurement | Ute | Shoshone |
| Minimum | 0.24% | 0.39% |
| Maximum | 10.1% | 12.6% |
| Range | 9.8% | 12.2% |
| Mean | 2.3% | 2.1% |
| Median | 0.92% | 1.4% |
| Interquartile 25% (IQ1) | 0.61% | 1.0% |
| Interquartile 75% (IQ3) | 2.0% | 2.1% |
| Interquartile Range (IQR) | 1.4% | 1.1% |
| Standard Deviation (Sample) | 3.4% | 2.7% |
| Standard Deviation (Population) | 3.2% | 2.6% |
Similar Demographics by No Schooling Completed
Demographics Similar to Ute by No Schooling Completed
In terms of no schooling completed, the demographic groups most similar to Ute are Samoan (2.3%, a difference of 0.040%), Immigrants from Morocco (2.3%, a difference of 0.19%), Immigrants from Panama (2.3%, a difference of 0.20%), Immigrants from Zaire (2.3%, a difference of 0.47%), and Native/Alaskan (2.2%, a difference of 0.66%).
| Demographics | Rating | Rank | No Schooling Completed |
| Bahamians | 11.6 /100 | #206 | Poor 2.2% |
| South American Indians | 11.0 /100 | #207 | Poor 2.2% |
| Uruguayans | 11.0 /100 | #208 | Poor 2.2% |
| Immigrants | Oceania | 10.2 /100 | #209 | Poor 2.2% |
| Natives/Alaskans | 10.0 /100 | #210 | Tragic 2.2% |
| Immigrants | Panama | 8.8 /100 | #211 | Tragic 2.3% |
| Immigrants | Morocco | 8.7 /100 | #212 | Tragic 2.3% |
| Ute | 8.2 /100 | #213 | Tragic 2.3% |
| Samoans | 8.2 /100 | #214 | Tragic 2.3% |
| Immigrants | Zaire | 7.2 /100 | #215 | Tragic 2.3% |
| Tongans | 6.8 /100 | #216 | Tragic 2.3% |
| Immigrants | Syria | 6.6 /100 | #217 | Tragic 2.3% |
| Immigrants | Nepal | 6.4 /100 | #218 | Tragic 2.3% |
| Senegalese | 5.6 /100 | #219 | Tragic 2.3% |
| Immigrants | Costa Rica | 5.1 /100 | #220 | Tragic 2.3% |
Demographics Similar to Shoshone by No Schooling Completed
In terms of no schooling completed, the demographic groups most similar to Shoshone are Soviet Union (2.0%, a difference of 0.080%), Immigrants from North Macedonia (2.0%, a difference of 0.15%), Immigrants from Moldova (2.0%, a difference of 0.26%), Immigrants from Iran (2.0%, a difference of 0.47%), and Alsatian (2.0%, a difference of 0.48%).
| Demographics | Rating | Rank | No Schooling Completed |
| Immigrants | Greece | 83.5 /100 | #141 | Excellent 2.0% |
| Venezuelans | 81.5 /100 | #142 | Excellent 2.0% |
| Immigrants | South Central Asia | 80.0 /100 | #143 | Good 2.0% |
| Alsatians | 79.1 /100 | #144 | Good 2.0% |
| Immigrants | Iran | 79.0 /100 | #145 | Good 2.0% |
| Immigrants | Moldova | 78.0 /100 | #146 | Good 2.0% |
| Soviet Union | 77.1 /100 | #147 | Good 2.0% |
| Shoshone | 76.7 /100 | #148 | Good 2.0% |
| Immigrants | North Macedonia | 75.9 /100 | #149 | Good 2.0% |
| Blackfeet | 72.9 /100 | #150 | Good 2.0% |
| Immigrants | Jordan | 70.9 /100 | #151 | Good 2.0% |
| Immigrants | Eastern Europe | 70.4 /100 | #152 | Good 2.0% |
| Immigrants | Italy | 68.9 /100 | #153 | Good 2.0% |
| Immigrants | Venezuela | 68.5 /100 | #154 | Good 2.0% |
| Immigrants | Russia | 67.6 /100 | #155 | Good 2.0% |