Latvian vs Fijian 7th Grade
COMPARE
Latvian
Fijian
7th Grade
7th Grade Comparison
Latvians
Fijians
97.2%
7TH GRADE
100.0/ 100
METRIC RATING
39th/ 347
METRIC RANK
94.7%
7TH GRADE
0.0/ 100
METRIC RATING
293rd/ 347
METRIC RANK
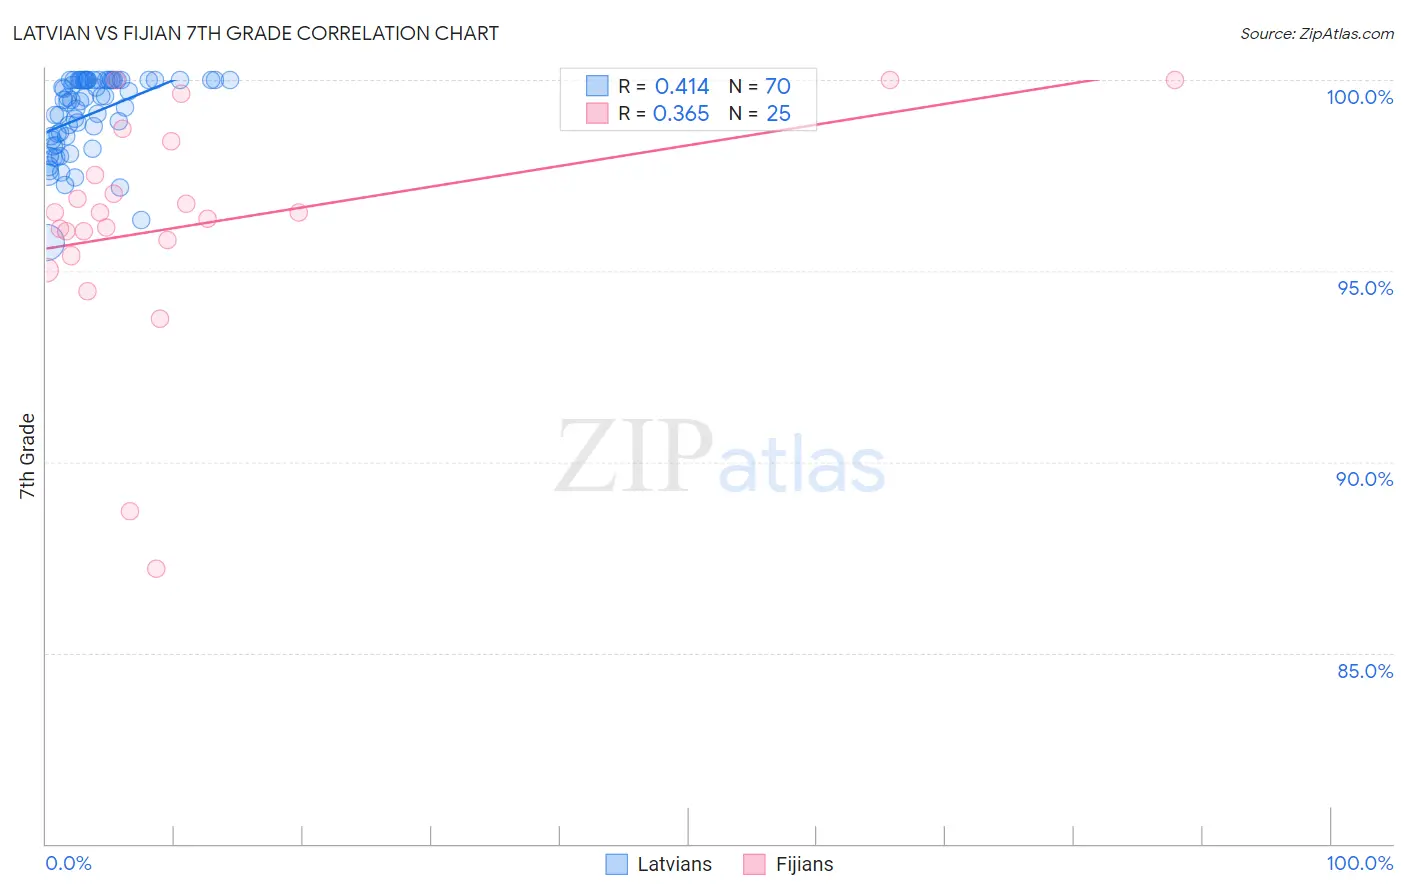
Latvian vs Fijian 7th Grade Correlation Chart
The statistical analysis conducted on geographies consisting of 220,726,452 people shows a moderate positive correlation between the proportion of Latvians and percentage of population with at least 7th grade education in the United States with a correlation coefficient (R) of 0.414 and weighted average of 97.2%. Similarly, the statistical analysis conducted on geographies consisting of 55,948,842 people shows a mild positive correlation between the proportion of Fijians and percentage of population with at least 7th grade education in the United States with a correlation coefficient (R) of 0.365 and weighted average of 94.7%, a difference of 2.6%.
7th Grade Correlation Summary
| Measurement | Latvian | Fijian |
| Minimum | 95.7% | 87.2% |
| Maximum | 100.0% | 100.0% |
| Range | 4.3% | 12.8% |
| Mean | 99.1% | 96.2% |
| Median | 99.5% | 96.5% |
| Interquartile 25% (IQ1) | 98.4% | 95.6% |
| Interquartile 75% (IQ3) | 100.0% | 97.9% |
| Interquartile Range (IQR) | 1.6% | 2.3% |
| Standard Deviation (Sample) | 1.0% | 3.0% |
| Standard Deviation (Population) | 1.0% | 3.0% |
Similar Demographics by 7th Grade
Demographics Similar to Latvians by 7th Grade
In terms of 7th grade, the demographic groups most similar to Latvians are Luxembourger (97.2%, a difference of 0.0%), Belgian (97.2%, a difference of 0.010%), British (97.2%, a difference of 0.020%), Eastern European (97.2%, a difference of 0.020%), and Hungarian (97.2%, a difference of 0.030%).
| Demographics | Rating | Rank | 7th Grade |
| Italians | 100.0 /100 | #32 | Exceptional 97.3% |
| Chippewa | 100.0 /100 | #33 | Exceptional 97.3% |
| Alaska Natives | 100.0 /100 | #34 | Exceptional 97.3% |
| Swiss | 100.0 /100 | #35 | Exceptional 97.3% |
| Hungarians | 100.0 /100 | #36 | Exceptional 97.2% |
| British | 100.0 /100 | #37 | Exceptional 97.2% |
| Belgians | 100.0 /100 | #38 | Exceptional 97.2% |
| Latvians | 100.0 /100 | #39 | Exceptional 97.2% |
| Luxembourgers | 100.0 /100 | #40 | Exceptional 97.2% |
| Eastern Europeans | 100.0 /100 | #41 | Exceptional 97.2% |
| Chinese | 99.9 /100 | #42 | Exceptional 97.1% |
| Maltese | 99.9 /100 | #43 | Exceptional 97.1% |
| Northern Europeans | 99.9 /100 | #44 | Exceptional 97.1% |
| Czechoslovakians | 99.9 /100 | #45 | Exceptional 97.1% |
| Aleuts | 99.9 /100 | #46 | Exceptional 97.1% |
Demographics Similar to Fijians by 7th Grade
In terms of 7th grade, the demographic groups most similar to Fijians are Immigrants from West Indies (94.8%, a difference of 0.020%), Immigrants from Grenada (94.8%, a difference of 0.040%), Haitian (94.7%, a difference of 0.080%), Malaysian (94.8%, a difference of 0.090%), and Taiwanese (94.8%, a difference of 0.10%).
| Demographics | Rating | Rank | 7th Grade |
| Immigrants | Philippines | 0.0 /100 | #286 | Tragic 94.9% |
| Immigrants | Peru | 0.0 /100 | #287 | Tragic 94.9% |
| British West Indians | 0.0 /100 | #288 | Tragic 94.8% |
| Taiwanese | 0.0 /100 | #289 | Tragic 94.8% |
| Malaysians | 0.0 /100 | #290 | Tragic 94.8% |
| Immigrants | Grenada | 0.0 /100 | #291 | Tragic 94.8% |
| Immigrants | West Indies | 0.0 /100 | #292 | Tragic 94.8% |
| Fijians | 0.0 /100 | #293 | Tragic 94.7% |
| Haitians | 0.0 /100 | #294 | Tragic 94.7% |
| Yaqui | 0.0 /100 | #295 | Tragic 94.6% |
| Cubans | 0.0 /100 | #296 | Tragic 94.6% |
| Immigrants | South Eastern Asia | 0.0 /100 | #297 | Tragic 94.5% |
| Indonesians | 0.0 /100 | #298 | Tragic 94.5% |
| Bangladeshis | 0.0 /100 | #299 | Tragic 94.5% |
| Immigrants | Burma/Myanmar | 0.0 /100 | #300 | Tragic 94.5% |