Ottawa vs Fijian 7th Grade
COMPARE
Ottawa
Fijian
7th Grade
7th Grade Comparison
Ottawa
Fijians
98.1%
7TH GRADE
100.0/ 100
METRIC RATING
4th/ 347
METRIC RANK
94.7%
7TH GRADE
0.0/ 100
METRIC RATING
293rd/ 347
METRIC RANK
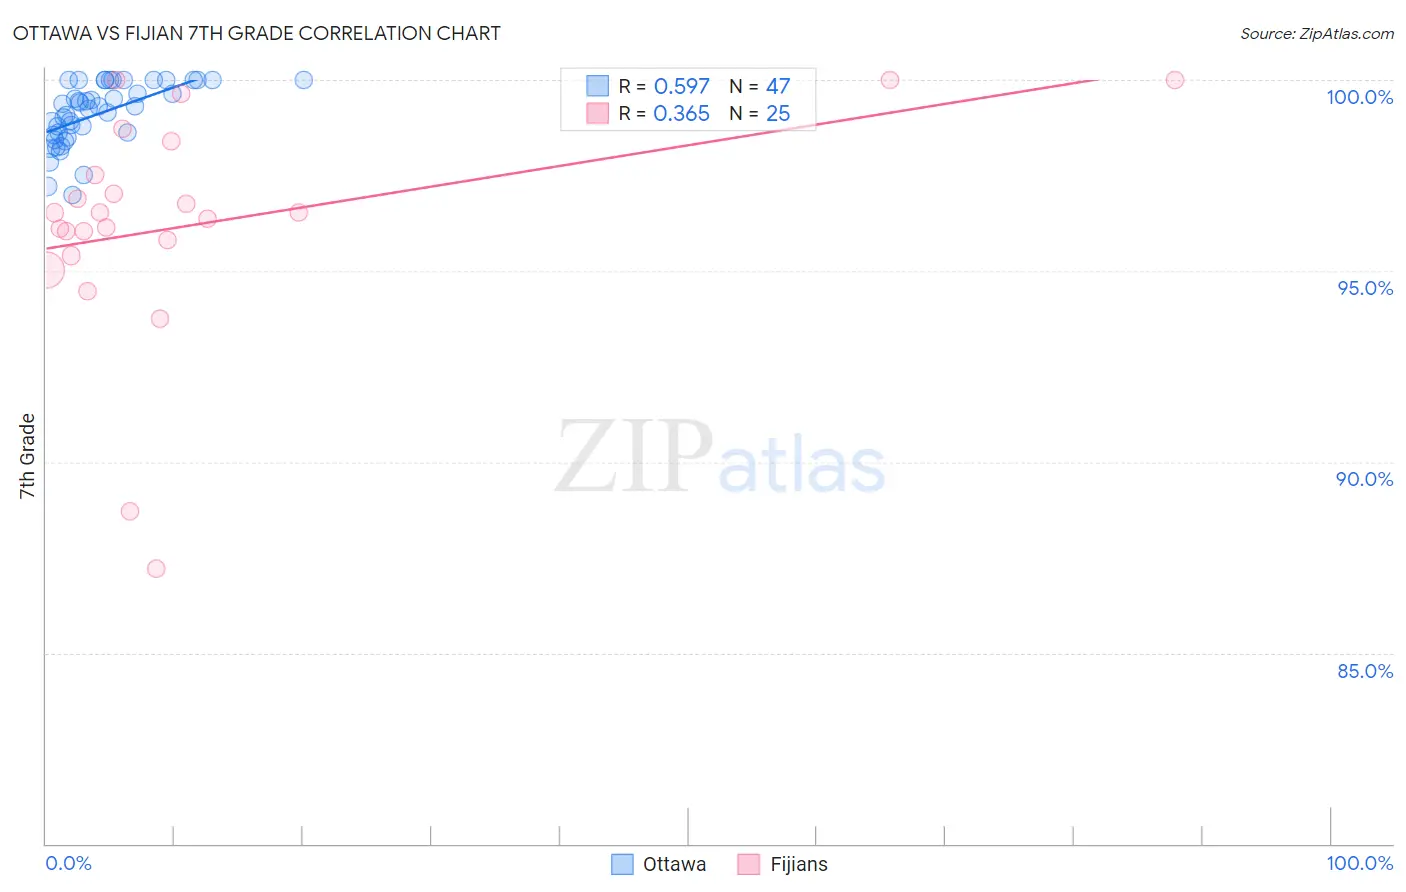
Ottawa vs Fijian 7th Grade Correlation Chart
The statistical analysis conducted on geographies consisting of 4,824,405 people shows a substantial positive correlation between the proportion of Ottawa and percentage of population with at least 7th grade education in the United States with a correlation coefficient (R) of 0.597 and weighted average of 98.1%. Similarly, the statistical analysis conducted on geographies consisting of 55,948,842 people shows a mild positive correlation between the proportion of Fijians and percentage of population with at least 7th grade education in the United States with a correlation coefficient (R) of 0.365 and weighted average of 94.7%, a difference of 3.6%.
7th Grade Correlation Summary
| Measurement | Ottawa | Fijian |
| Minimum | 97.0% | 87.2% |
| Maximum | 100.0% | 100.0% |
| Range | 3.0% | 12.8% |
| Mean | 99.1% | 96.2% |
| Median | 99.3% | 96.5% |
| Interquartile 25% (IQ1) | 98.5% | 95.6% |
| Interquartile 75% (IQ3) | 100.0% | 97.9% |
| Interquartile Range (IQR) | 1.5% | 2.3% |
| Standard Deviation (Sample) | 0.80% | 3.0% |
| Standard Deviation (Population) | 0.79% | 3.0% |
Similar Demographics by 7th Grade
Demographics Similar to Ottawa by 7th Grade
In terms of 7th grade, the demographic groups most similar to Ottawa are Carpatho Rusyn (98.3%, a difference of 0.20%), Dutch (97.9%, a difference of 0.27%), Tsimshian (97.8%, a difference of 0.33%), Norwegian (97.8%, a difference of 0.36%), and Finnish (98.5%, a difference of 0.37%).
| Demographics | Rating | Rank | 7th Grade |
| Crow | 100.0 /100 | #1 | Exceptional 99.1% |
| Finns | 100.0 /100 | #2 | Exceptional 98.5% |
| Carpatho Rusyns | 100.0 /100 | #3 | Exceptional 98.3% |
| Ottawa | 100.0 /100 | #4 | Exceptional 98.1% |
| Dutch | 100.0 /100 | #5 | Exceptional 97.9% |
| Tsimshian | 100.0 /100 | #6 | Exceptional 97.8% |
| Norwegians | 100.0 /100 | #7 | Exceptional 97.8% |
| Slovaks | 100.0 /100 | #8 | Exceptional 97.8% |
| Germans | 100.0 /100 | #9 | Exceptional 97.7% |
| Slovenes | 100.0 /100 | #10 | Exceptional 97.6% |
| Alaskan Athabascans | 100.0 /100 | #11 | Exceptional 97.6% |
| Poles | 100.0 /100 | #12 | Exceptional 97.6% |
| Swedes | 100.0 /100 | #13 | Exceptional 97.6% |
| Pennsylvania Germans | 100.0 /100 | #14 | Exceptional 97.6% |
| English | 100.0 /100 | #15 | Exceptional 97.6% |
Demographics Similar to Fijians by 7th Grade
In terms of 7th grade, the demographic groups most similar to Fijians are Immigrants from West Indies (94.8%, a difference of 0.020%), Immigrants from Grenada (94.8%, a difference of 0.040%), Haitian (94.7%, a difference of 0.080%), Malaysian (94.8%, a difference of 0.090%), and Taiwanese (94.8%, a difference of 0.10%).
| Demographics | Rating | Rank | 7th Grade |
| Immigrants | Philippines | 0.0 /100 | #286 | Tragic 94.9% |
| Immigrants | Peru | 0.0 /100 | #287 | Tragic 94.9% |
| British West Indians | 0.0 /100 | #288 | Tragic 94.8% |
| Taiwanese | 0.0 /100 | #289 | Tragic 94.8% |
| Malaysians | 0.0 /100 | #290 | Tragic 94.8% |
| Immigrants | Grenada | 0.0 /100 | #291 | Tragic 94.8% |
| Immigrants | West Indies | 0.0 /100 | #292 | Tragic 94.8% |
| Fijians | 0.0 /100 | #293 | Tragic 94.7% |
| Haitians | 0.0 /100 | #294 | Tragic 94.7% |
| Yaqui | 0.0 /100 | #295 | Tragic 94.6% |
| Cubans | 0.0 /100 | #296 | Tragic 94.6% |
| Immigrants | South Eastern Asia | 0.0 /100 | #297 | Tragic 94.5% |
| Indonesians | 0.0 /100 | #298 | Tragic 94.5% |
| Bangladeshis | 0.0 /100 | #299 | Tragic 94.5% |
| Immigrants | Burma/Myanmar | 0.0 /100 | #300 | Tragic 94.5% |