Immigrants from Zaire vs Central American 8th Grade
COMPARE
Immigrants from Zaire
Central American
8th Grade
8th Grade Comparison
Immigrants from Zaire
Central Americans
95.6%
8TH GRADE
25.2/ 100
METRIC RATING
195th/ 347
METRIC RANK
91.6%
8TH GRADE
0.0/ 100
METRIC RATING
338th/ 347
METRIC RANK
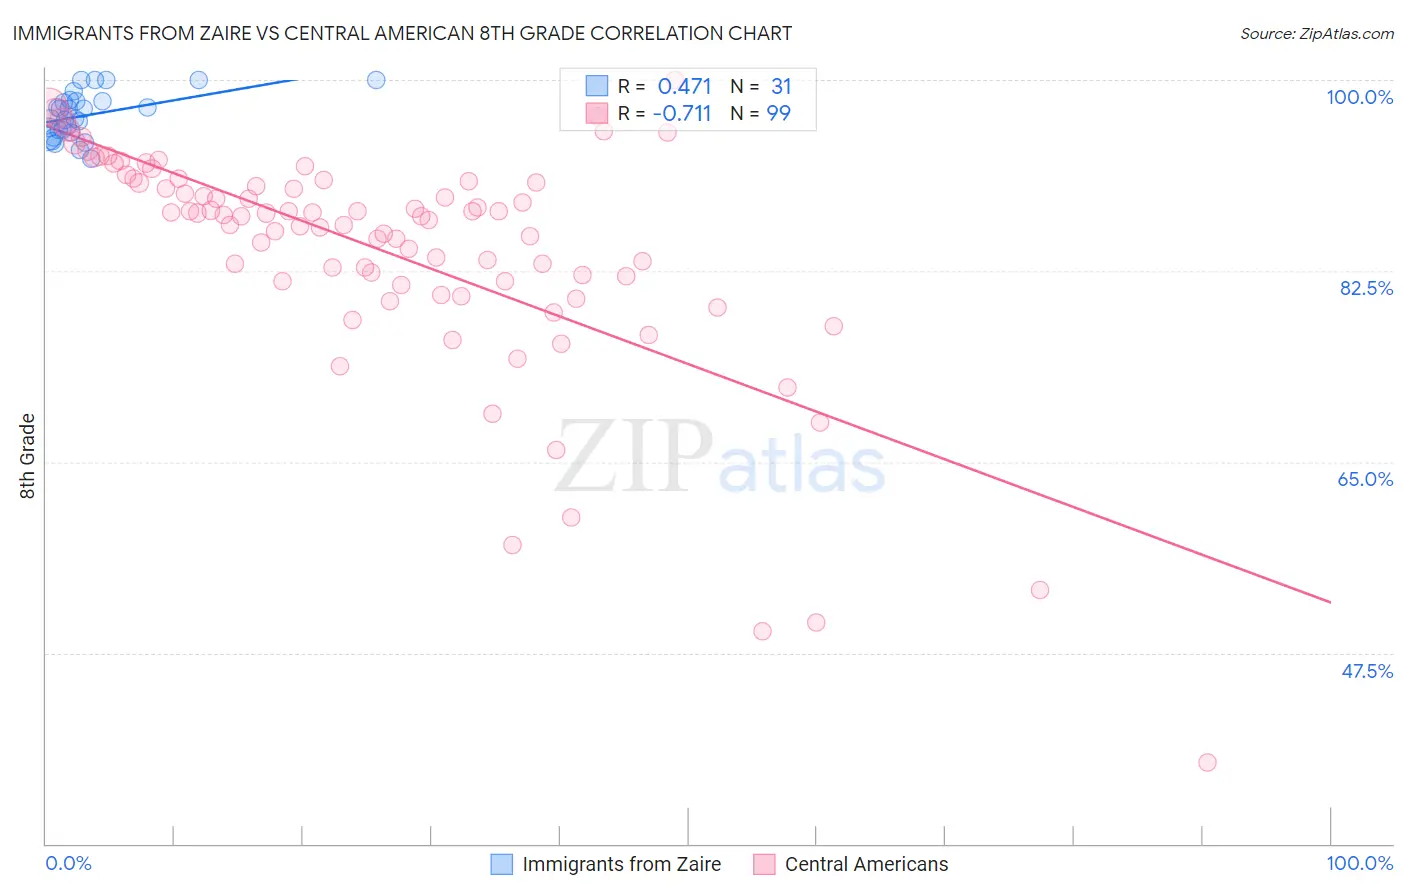
Immigrants from Zaire vs Central American 8th Grade Correlation Chart
The statistical analysis conducted on geographies consisting of 107,212,695 people shows a moderate positive correlation between the proportion of Immigrants from Zaire and percentage of population with at least 8th grade education in the United States with a correlation coefficient (R) of 0.471 and weighted average of 95.6%. Similarly, the statistical analysis conducted on geographies consisting of 504,619,347 people shows a strong negative correlation between the proportion of Central Americans and percentage of population with at least 8th grade education in the United States with a correlation coefficient (R) of -0.711 and weighted average of 91.6%, a difference of 4.4%.
8th Grade Correlation Summary
| Measurement | Immigrants from Zaire | Central American |
| Minimum | 92.8% | 37.5% |
| Maximum | 100.0% | 100.0% |
| Range | 7.2% | 62.5% |
| Mean | 96.8% | 84.3% |
| Median | 96.5% | 87.6% |
| Interquartile 25% (IQ1) | 95.2% | 81.6% |
| Interquartile 75% (IQ3) | 98.1% | 90.8% |
| Interquartile Range (IQR) | 2.9% | 9.2% |
| Standard Deviation (Sample) | 2.1% | 10.8% |
| Standard Deviation (Population) | 2.0% | 10.7% |
Similar Demographics by 8th Grade
Demographics Similar to Immigrants from Zaire by 8th Grade
In terms of 8th grade, the demographic groups most similar to Immigrants from Zaire are Guamanian/Chamorro (95.6%, a difference of 0.010%), Assyrian/Chaldean/Syriac (95.6%, a difference of 0.010%), Sierra Leonean (95.6%, a difference of 0.010%), Paraguayan (95.5%, a difference of 0.020%), and Immigrants from Northern Africa (95.5%, a difference of 0.020%).
| Demographics | Rating | Rank | 8th Grade |
| Liberians | 32.4 /100 | #188 | Fair 95.6% |
| Immigrants | Micronesia | 31.6 /100 | #189 | Fair 95.6% |
| Immigrants | Venezuela | 30.8 /100 | #190 | Fair 95.6% |
| Immigrants | Nepal | 30.2 /100 | #191 | Fair 95.6% |
| Pima | 28.6 /100 | #192 | Fair 95.6% |
| Panamanians | 28.4 /100 | #193 | Fair 95.6% |
| Guamanians/Chamorros | 26.6 /100 | #194 | Fair 95.6% |
| Immigrants | Zaire | 25.2 /100 | #195 | Fair 95.6% |
| Assyrians/Chaldeans/Syriacs | 24.5 /100 | #196 | Fair 95.6% |
| Sierra Leoneans | 24.3 /100 | #197 | Fair 95.6% |
| Paraguayans | 22.6 /100 | #198 | Fair 95.5% |
| Immigrants | Northern Africa | 22.5 /100 | #199 | Fair 95.5% |
| Argentineans | 22.2 /100 | #200 | Fair 95.5% |
| Immigrants | Argentina | 20.6 /100 | #201 | Fair 95.5% |
| Apache | 19.4 /100 | #202 | Poor 95.5% |
Demographics Similar to Central Americans by 8th Grade
In terms of 8th grade, the demographic groups most similar to Central Americans are Immigrants from Latin America (91.7%, a difference of 0.14%), Mexican (91.4%, a difference of 0.23%), Yakama (91.2%, a difference of 0.36%), Immigrants from Honduras (91.9%, a difference of 0.37%), and Guatemalan (91.1%, a difference of 0.47%).
| Demographics | Rating | Rank | 8th Grade |
| Hondurans | 0.0 /100 | #331 | Tragic 92.3% |
| Immigrants | Dominican Republic | 0.0 /100 | #332 | Tragic 92.3% |
| Hispanics or Latinos | 0.0 /100 | #333 | Tragic 92.2% |
| Immigrants | Yemen | 0.0 /100 | #334 | Tragic 92.1% |
| Mexican American Indians | 0.0 /100 | #335 | Tragic 92.1% |
| Immigrants | Honduras | 0.0 /100 | #336 | Tragic 91.9% |
| Immigrants | Latin America | 0.0 /100 | #337 | Tragic 91.7% |
| Central Americans | 0.0 /100 | #338 | Tragic 91.6% |
| Mexicans | 0.0 /100 | #339 | Tragic 91.4% |
| Yakama | 0.0 /100 | #340 | Tragic 91.2% |
| Guatemalans | 0.0 /100 | #341 | Tragic 91.1% |
| Salvadorans | 0.0 /100 | #342 | Tragic 90.9% |
| Immigrants | Guatemala | 0.0 /100 | #343 | Tragic 90.7% |
| Immigrants | Central America | 0.0 /100 | #344 | Tragic 90.4% |
| Immigrants | El Salvador | 0.0 /100 | #345 | Tragic 90.3% |