Ute vs Polish 8th Grade
COMPARE
Ute
Polish
8th Grade
8th Grade Comparison
Ute
Poles
95.8%
8TH GRADE
58.5/ 100
METRIC RATING
170th/ 347
METRIC RANK
97.4%
8TH GRADE
100.0/ 100
METRIC RATING
11th/ 347
METRIC RANK
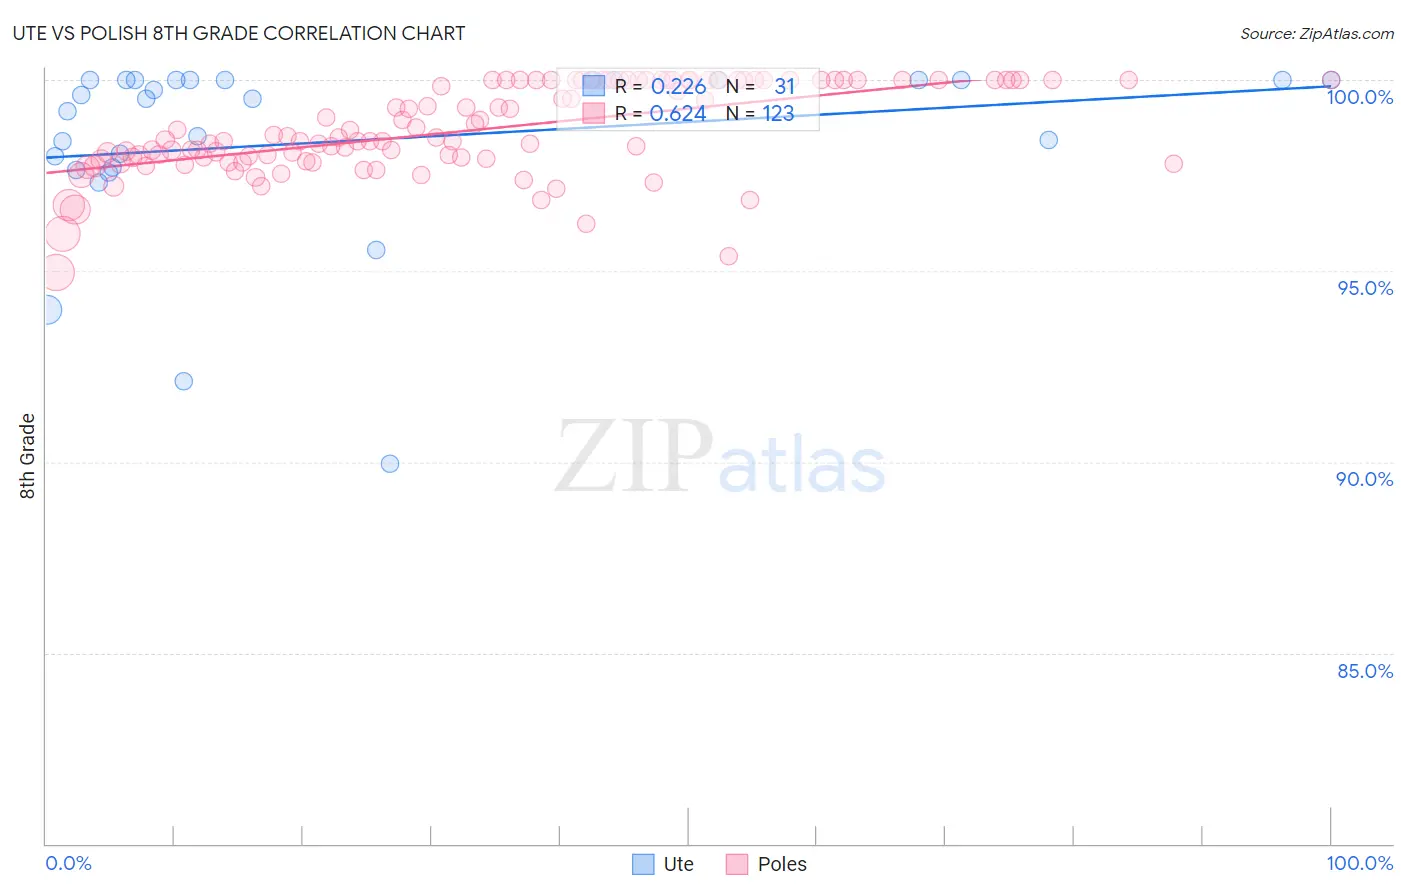
Ute vs Polish 8th Grade Correlation Chart
The statistical analysis conducted on geographies consisting of 55,668,539 people shows a weak positive correlation between the proportion of Ute and percentage of population with at least 8th grade education in the United States with a correlation coefficient (R) of 0.226 and weighted average of 95.8%. Similarly, the statistical analysis conducted on geographies consisting of 475,812,379 people shows a significant positive correlation between the proportion of Poles and percentage of population with at least 8th grade education in the United States with a correlation coefficient (R) of 0.624 and weighted average of 97.4%, a difference of 1.7%.
8th Grade Correlation Summary
| Measurement | Ute | Polish |
| Minimum | 89.9% | 95.0% |
| Maximum | 100.0% | 100.0% |
| Range | 10.1% | 5.0% |
| Mean | 98.4% | 98.7% |
| Median | 99.5% | 98.4% |
| Interquartile 25% (IQ1) | 97.7% | 97.9% |
| Interquartile 75% (IQ3) | 100.0% | 100.0% |
| Interquartile Range (IQR) | 2.3% | 2.1% |
| Standard Deviation (Sample) | 2.5% | 1.2% |
| Standard Deviation (Population) | 2.4% | 1.2% |
Similar Demographics by 8th Grade
Demographics Similar to Ute by 8th Grade
In terms of 8th grade, the demographic groups most similar to Ute are Immigrants from Iran (95.8%, a difference of 0.0%), Egyptian (95.8%, a difference of 0.0%), Immigrants from Korea (95.8%, a difference of 0.0%), Spaniard (95.8%, a difference of 0.010%), and Immigrants from Ukraine (95.8%, a difference of 0.010%).
| Demographics | Rating | Rank | 8th Grade |
| Immigrants | Sri Lanka | 64.1 /100 | #163 | Good 95.8% |
| Immigrants | Italy | 63.5 /100 | #164 | Good 95.8% |
| Alsatians | 61.4 /100 | #165 | Good 95.8% |
| Immigrants | Poland | 61.1 /100 | #166 | Good 95.8% |
| Spaniards | 60.0 /100 | #167 | Good 95.8% |
| Immigrants | Ukraine | 59.5 /100 | #168 | Average 95.8% |
| Immigrants | Iran | 58.6 /100 | #169 | Average 95.8% |
| Ute | 58.5 /100 | #170 | Average 95.8% |
| Egyptians | 58.2 /100 | #171 | Average 95.8% |
| Immigrants | Korea | 57.9 /100 | #172 | Average 95.8% |
| Mongolians | 53.0 /100 | #173 | Average 95.8% |
| Chileans | 50.0 /100 | #174 | Average 95.7% |
| Immigrants | Albania | 49.6 /100 | #175 | Average 95.7% |
| Pakistanis | 48.8 /100 | #176 | Average 95.7% |
| Marshallese | 47.6 /100 | #177 | Average 95.7% |
Demographics Similar to Poles by 8th Grade
In terms of 8th grade, the demographic groups most similar to Poles are Slovene (97.5%, a difference of 0.030%), Swedish (97.4%, a difference of 0.030%), Alaskan Athabascan (97.3%, a difference of 0.10%), English (97.3%, a difference of 0.10%), and German (97.5%, a difference of 0.11%).
| Demographics | Rating | Rank | 8th Grade |
| Carpatho Rusyns | 100.0 /100 | #4 | Exceptional 98.1% |
| Ottawa | 100.0 /100 | #5 | Exceptional 97.9% |
| Dutch | 100.0 /100 | #6 | Exceptional 97.7% |
| Norwegians | 100.0 /100 | #7 | Exceptional 97.6% |
| Slovaks | 100.0 /100 | #8 | Exceptional 97.6% |
| Germans | 100.0 /100 | #9 | Exceptional 97.5% |
| Slovenes | 100.0 /100 | #10 | Exceptional 97.5% |
| Poles | 100.0 /100 | #11 | Exceptional 97.4% |
| Swedes | 100.0 /100 | #12 | Exceptional 97.4% |
| Alaskan Athabascans | 100.0 /100 | #13 | Exceptional 97.3% |
| English | 100.0 /100 | #14 | Exceptional 97.3% |
| Pennsylvania Germans | 100.0 /100 | #15 | Exceptional 97.3% |
| Tlingit-Haida | 100.0 /100 | #16 | Exceptional 97.3% |
| Irish | 100.0 /100 | #17 | Exceptional 97.3% |
| Lithuanians | 100.0 /100 | #18 | Exceptional 97.3% |