Slovene vs Northern European Doctorate Degree
COMPARE
Slovene
Northern European
Doctorate Degree
Doctorate Degree Comparison
Slovenes
Northern Europeans
1.9%
DOCTORATE DEGREE
70.2/ 100
METRIC RATING
159th/ 347
METRIC RANK
2.2%
DOCTORATE DEGREE
99.7/ 100
METRIC RATING
79th/ 347
METRIC RANK
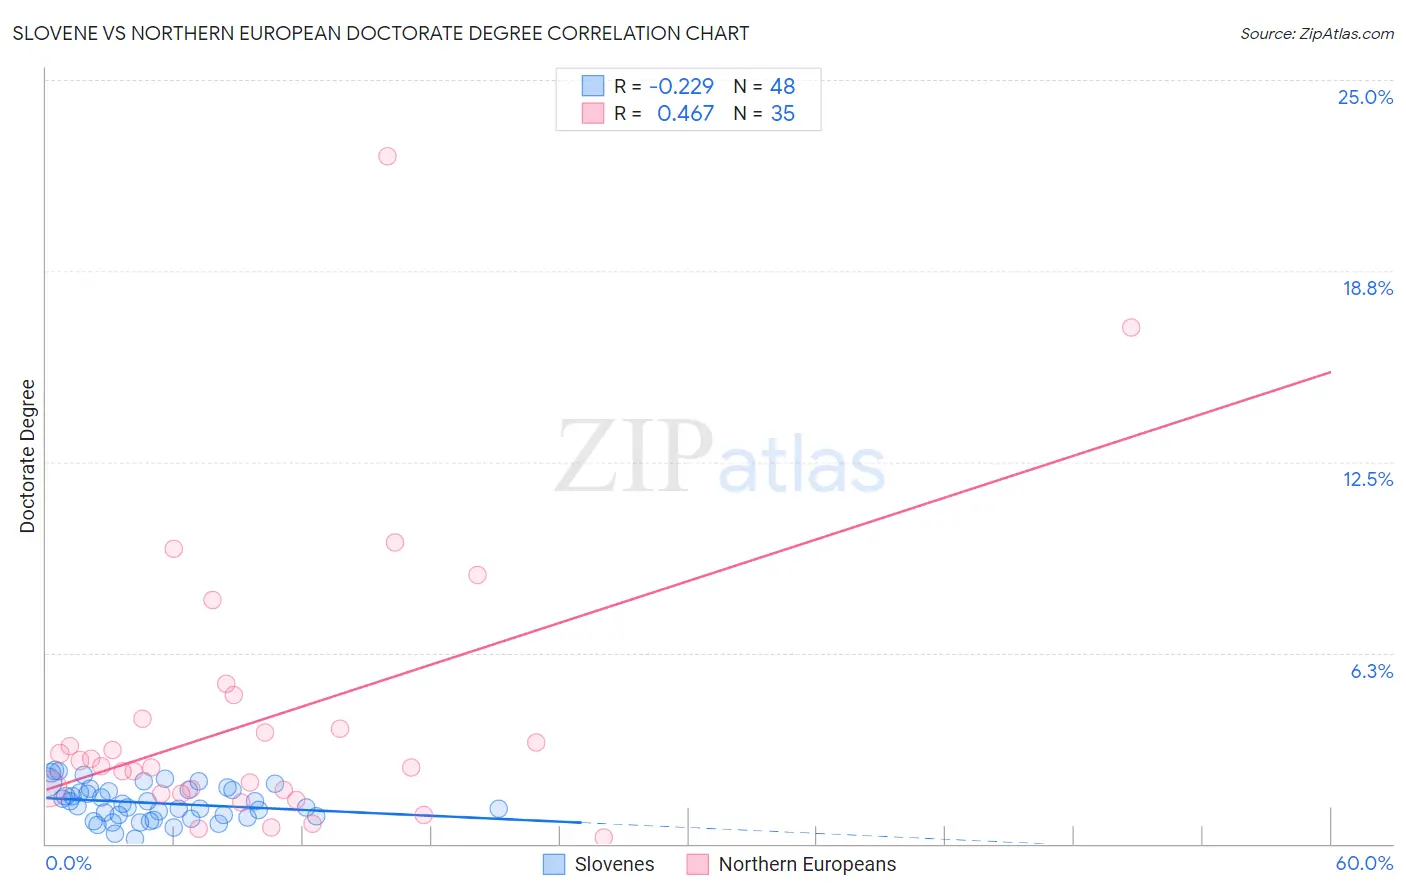
Slovene vs Northern European Doctorate Degree Correlation Chart
The statistical analysis conducted on geographies consisting of 259,569,588 people shows a weak negative correlation between the proportion of Slovenes and percentage of population with at least doctorate degree education in the United States with a correlation coefficient (R) of -0.229 and weighted average of 1.9%. Similarly, the statistical analysis conducted on geographies consisting of 401,433,855 people shows a moderate positive correlation between the proportion of Northern Europeans and percentage of population with at least doctorate degree education in the United States with a correlation coefficient (R) of 0.467 and weighted average of 2.2%, a difference of 17.7%.
Doctorate Degree Correlation Summary
| Measurement | Slovene | Northern European |
| Minimum | 0.15% | 0.22% |
| Maximum | 2.4% | 22.5% |
| Range | 2.2% | 22.3% |
| Mean | 1.3% | 4.1% |
| Median | 1.3% | 2.5% |
| Interquartile 25% (IQ1) | 0.87% | 1.6% |
| Interquartile 75% (IQ3) | 1.8% | 4.1% |
| Interquartile Range (IQR) | 0.89% | 2.5% |
| Standard Deviation (Sample) | 0.57% | 4.7% |
| Standard Deviation (Population) | 0.56% | 4.6% |
Similar Demographics by Doctorate Degree
Demographics Similar to Slovenes by Doctorate Degree
In terms of doctorate degree, the demographic groups most similar to Slovenes are Welsh (1.9%, a difference of 0.090%), Immigrants from Middle Africa (1.9%, a difference of 0.24%), Hungarian (1.9%, a difference of 0.26%), Danish (1.9%, a difference of 0.29%), and Slavic (1.9%, a difference of 0.37%).
| Demographics | Rating | Rank | Doctorate Degree |
| Immigrants | Kenya | 74.3 /100 | #152 | Good 1.9% |
| Immigrants | Oceania | 74.0 /100 | #153 | Good 1.9% |
| Immigrants | Albania | 72.8 /100 | #154 | Good 1.9% |
| Poles | 72.7 /100 | #155 | Good 1.9% |
| Slavs | 72.4 /100 | #156 | Good 1.9% |
| Danes | 71.9 /100 | #157 | Good 1.9% |
| Hungarians | 71.7 /100 | #158 | Good 1.9% |
| Slovenes | 70.2 /100 | #159 | Good 1.9% |
| Welsh | 69.7 /100 | #160 | Good 1.9% |
| Immigrants | Middle Africa | 68.8 /100 | #161 | Good 1.9% |
| Irish | 67.5 /100 | #162 | Good 1.9% |
| Czechs | 67.3 /100 | #163 | Good 1.9% |
| Celtics | 66.7 /100 | #164 | Good 1.9% |
| Scotch-Irish | 63.6 /100 | #165 | Good 1.9% |
| Spaniards | 63.5 /100 | #166 | Good 1.9% |
Demographics Similar to Northern Europeans by Doctorate Degree
In terms of doctorate degree, the demographic groups most similar to Northern Europeans are Immigrants from Belarus (2.2%, a difference of 0.070%), Ugandan (2.2%, a difference of 0.28%), Immigrants from Argentina (2.2%, a difference of 0.34%), Immigrants from Lebanon (2.2%, a difference of 0.59%), and Immigrants from Hungary (2.2%, a difference of 0.60%).
| Demographics | Rating | Rank | Doctorate Degree |
| Immigrants | Canada | 99.8 /100 | #72 | Exceptional 2.3% |
| Immigrants | Bulgaria | 99.8 /100 | #73 | Exceptional 2.3% |
| Immigrants | North America | 99.8 /100 | #74 | Exceptional 2.2% |
| Immigrants | Western Asia | 99.8 /100 | #75 | Exceptional 2.2% |
| Immigrants | Hungary | 99.8 /100 | #76 | Exceptional 2.2% |
| Immigrants | Lebanon | 99.8 /100 | #77 | Exceptional 2.2% |
| Immigrants | Belarus | 99.7 /100 | #78 | Exceptional 2.2% |
| Northern Europeans | 99.7 /100 | #79 | Exceptional 2.2% |
| Ugandans | 99.7 /100 | #80 | Exceptional 2.2% |
| Immigrants | Argentina | 99.7 /100 | #81 | Exceptional 2.2% |
| Immigrants | Uganda | 99.6 /100 | #82 | Exceptional 2.2% |
| Immigrants | Lithuania | 99.6 /100 | #83 | Exceptional 2.2% |
| Immigrants | England | 99.6 /100 | #84 | Exceptional 2.2% |
| Immigrants | Brazil | 99.6 /100 | #85 | Exceptional 2.2% |
| Egyptians | 99.4 /100 | #86 | Exceptional 2.2% |