Choctaw vs Northern European Doctorate Degree
COMPARE
Choctaw
Northern European
Doctorate Degree
Doctorate Degree Comparison
Choctaw
Northern Europeans
1.4%
DOCTORATE DEGREE
0.3/ 100
METRIC RATING
290th/ 347
METRIC RANK
2.2%
DOCTORATE DEGREE
99.7/ 100
METRIC RATING
79th/ 347
METRIC RANK
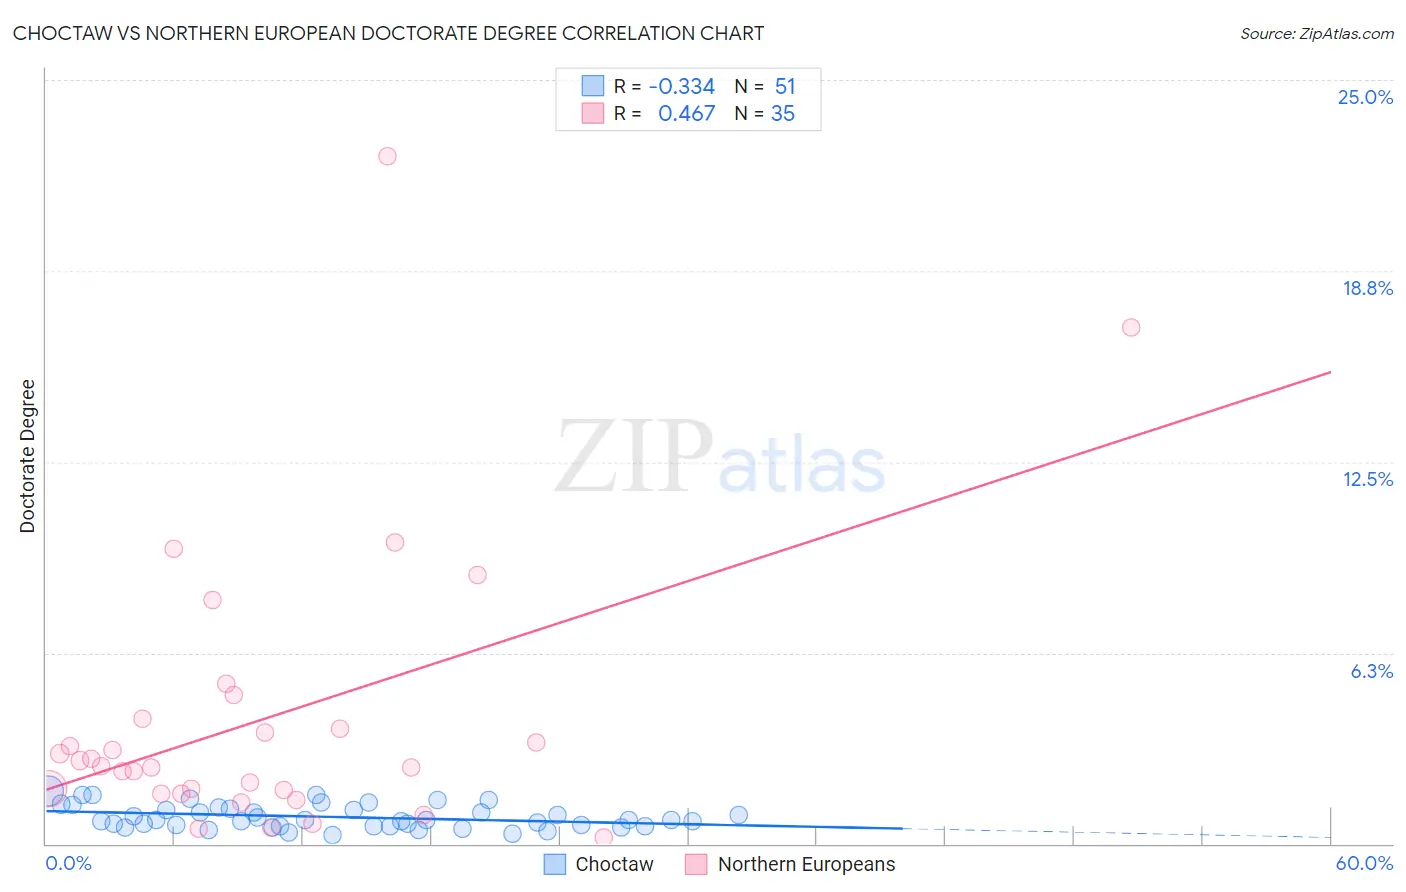
Choctaw vs Northern European Doctorate Degree Correlation Chart
The statistical analysis conducted on geographies consisting of 265,489,053 people shows a mild negative correlation between the proportion of Choctaw and percentage of population with at least doctorate degree education in the United States with a correlation coefficient (R) of -0.334 and weighted average of 1.4%. Similarly, the statistical analysis conducted on geographies consisting of 401,433,855 people shows a moderate positive correlation between the proportion of Northern Europeans and percentage of population with at least doctorate degree education in the United States with a correlation coefficient (R) of 0.467 and weighted average of 2.2%, a difference of 54.4%.
Doctorate Degree Correlation Summary
| Measurement | Choctaw | Northern European |
| Minimum | 0.28% | 0.22% |
| Maximum | 1.7% | 22.5% |
| Range | 1.5% | 22.3% |
| Mean | 0.88% | 4.1% |
| Median | 0.76% | 2.5% |
| Interquartile 25% (IQ1) | 0.59% | 1.6% |
| Interquartile 75% (IQ3) | 1.1% | 4.1% |
| Interquartile Range (IQR) | 0.54% | 2.5% |
| Standard Deviation (Sample) | 0.38% | 4.7% |
| Standard Deviation (Population) | 0.38% | 4.6% |
Similar Demographics by Doctorate Degree
Demographics Similar to Choctaw by Doctorate Degree
In terms of doctorate degree, the demographic groups most similar to Choctaw are Cape Verdean (1.4%, a difference of 0.020%), Immigrants from El Salvador (1.4%, a difference of 0.15%), Black/African American (1.4%, a difference of 0.23%), Cajun (1.5%, a difference of 0.33%), and Alaska Native (1.4%, a difference of 0.40%).
| Demographics | Rating | Rank | Doctorate Degree |
| Central Americans | 0.3 /100 | #283 | Tragic 1.5% |
| Jamaicans | 0.3 /100 | #284 | Tragic 1.5% |
| Malaysians | 0.3 /100 | #285 | Tragic 1.5% |
| Cherokee | 0.3 /100 | #286 | Tragic 1.5% |
| Cajuns | 0.3 /100 | #287 | Tragic 1.5% |
| Immigrants | El Salvador | 0.3 /100 | #288 | Tragic 1.4% |
| Cape Verdeans | 0.3 /100 | #289 | Tragic 1.4% |
| Choctaw | 0.3 /100 | #290 | Tragic 1.4% |
| Blacks/African Americans | 0.3 /100 | #291 | Tragic 1.4% |
| Alaska Natives | 0.3 /100 | #292 | Tragic 1.4% |
| Immigrants | Yemen | 0.2 /100 | #293 | Tragic 1.4% |
| Samoans | 0.2 /100 | #294 | Tragic 1.4% |
| Guatemalans | 0.2 /100 | #295 | Tragic 1.4% |
| Immigrants | Ecuador | 0.2 /100 | #296 | Tragic 1.4% |
| Tsimshian | 0.2 /100 | #297 | Tragic 1.4% |
Demographics Similar to Northern Europeans by Doctorate Degree
In terms of doctorate degree, the demographic groups most similar to Northern Europeans are Immigrants from Belarus (2.2%, a difference of 0.070%), Ugandan (2.2%, a difference of 0.28%), Immigrants from Argentina (2.2%, a difference of 0.34%), Immigrants from Lebanon (2.2%, a difference of 0.59%), and Immigrants from Hungary (2.2%, a difference of 0.60%).
| Demographics | Rating | Rank | Doctorate Degree |
| Immigrants | Canada | 99.8 /100 | #72 | Exceptional 2.3% |
| Immigrants | Bulgaria | 99.8 /100 | #73 | Exceptional 2.3% |
| Immigrants | North America | 99.8 /100 | #74 | Exceptional 2.2% |
| Immigrants | Western Asia | 99.8 /100 | #75 | Exceptional 2.2% |
| Immigrants | Hungary | 99.8 /100 | #76 | Exceptional 2.2% |
| Immigrants | Lebanon | 99.8 /100 | #77 | Exceptional 2.2% |
| Immigrants | Belarus | 99.7 /100 | #78 | Exceptional 2.2% |
| Northern Europeans | 99.7 /100 | #79 | Exceptional 2.2% |
| Ugandans | 99.7 /100 | #80 | Exceptional 2.2% |
| Immigrants | Argentina | 99.7 /100 | #81 | Exceptional 2.2% |
| Immigrants | Uganda | 99.6 /100 | #82 | Exceptional 2.2% |
| Immigrants | Lithuania | 99.6 /100 | #83 | Exceptional 2.2% |
| Immigrants | England | 99.6 /100 | #84 | Exceptional 2.2% |
| Immigrants | Brazil | 99.6 /100 | #85 | Exceptional 2.2% |
| Egyptians | 99.4 /100 | #86 | Exceptional 2.2% |