Immigrants from Somalia vs Luxembourger Doctorate Degree
COMPARE
Immigrants from Somalia
Luxembourger
Doctorate Degree
Doctorate Degree Comparison
Immigrants from Somalia
Luxembourgers
1.8%
DOCTORATE DEGREE
25.4/ 100
METRIC RATING
195th/ 347
METRIC RANK
1.9%
DOCTORATE DEGREE
81.1/ 100
METRIC RATING
148th/ 347
METRIC RANK
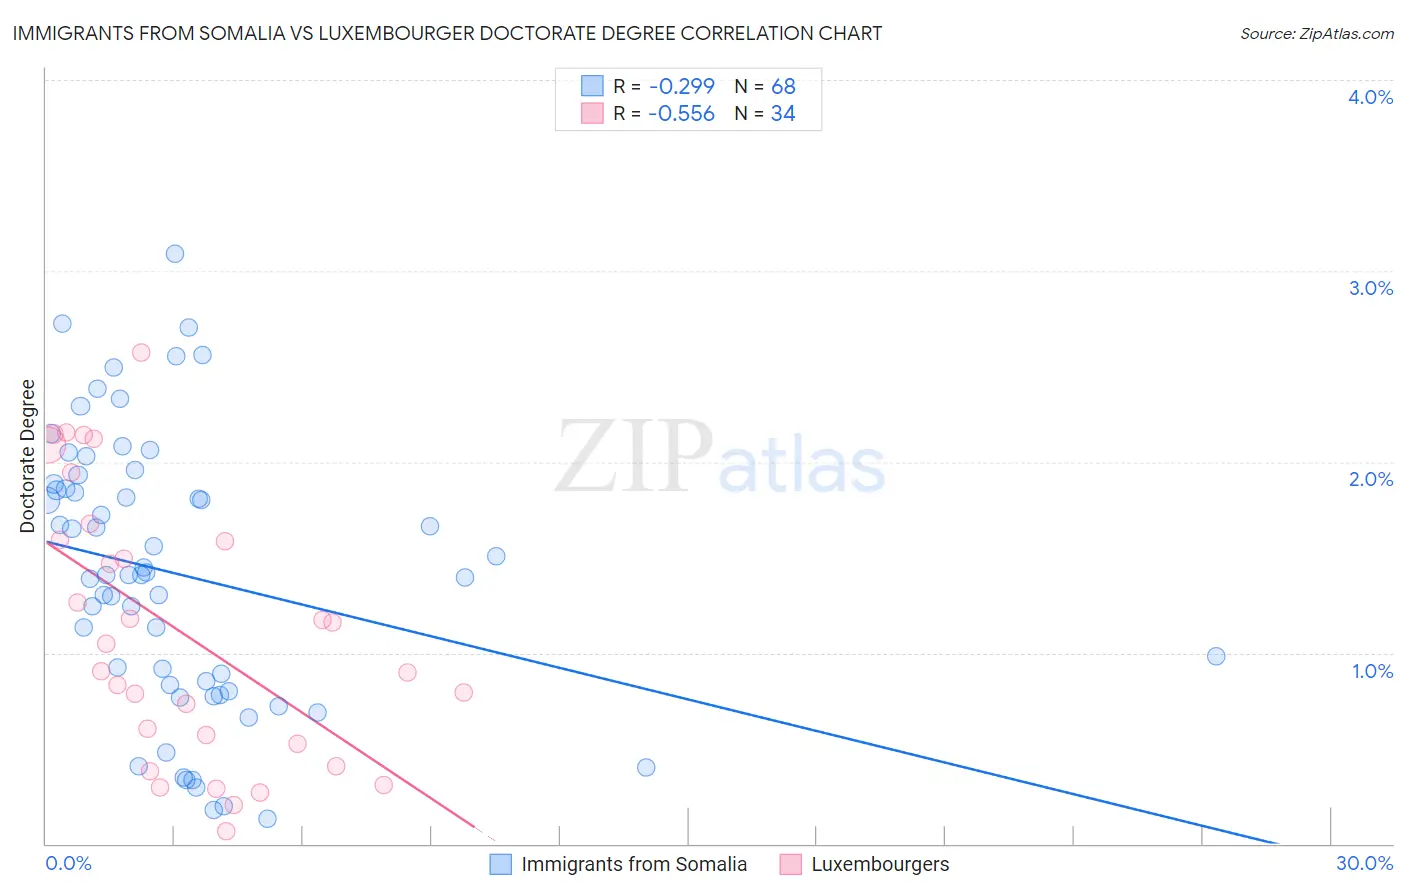
Immigrants from Somalia vs Luxembourger Doctorate Degree Correlation Chart
The statistical analysis conducted on geographies consisting of 91,934,011 people shows a weak negative correlation between the proportion of Immigrants from Somalia and percentage of population with at least doctorate degree education in the United States with a correlation coefficient (R) of -0.299 and weighted average of 1.8%. Similarly, the statistical analysis conducted on geographies consisting of 144,093,078 people shows a substantial negative correlation between the proportion of Luxembourgers and percentage of population with at least doctorate degree education in the United States with a correlation coefficient (R) of -0.556 and weighted average of 1.9%, a difference of 9.7%.
Doctorate Degree Correlation Summary
| Measurement | Immigrants from Somalia | Luxembourger |
| Minimum | 0.13% | 0.063% |
| Maximum | 3.1% | 2.6% |
| Range | 3.0% | 2.5% |
| Mean | 1.4% | 1.1% |
| Median | 1.4% | 0.98% |
| Interquartile 25% (IQ1) | 0.82% | 0.52% |
| Interquartile 75% (IQ3) | 1.9% | 1.6% |
| Interquartile Range (IQR) | 1.1% | 1.1% |
| Standard Deviation (Sample) | 0.72% | 0.70% |
| Standard Deviation (Population) | 0.71% | 0.69% |
Similar Demographics by Doctorate Degree
Demographics Similar to Immigrants from Somalia by Doctorate Degree
In terms of doctorate degree, the demographic groups most similar to Immigrants from Somalia are Subsaharan African (1.8%, a difference of 0.070%), Chinese (1.8%, a difference of 0.070%), Uruguayan (1.8%, a difference of 0.15%), Immigrants from Ghana (1.8%, a difference of 0.16%), and German Russian (1.8%, a difference of 0.33%).
| Demographics | Rating | Rank | Doctorate Degree |
| Germans | 30.5 /100 | #188 | Fair 1.8% |
| French Canadians | 30.2 /100 | #189 | Fair 1.8% |
| Immigrants | Costa Rica | 30.2 /100 | #190 | Fair 1.8% |
| South Americans | 29.5 /100 | #191 | Fair 1.8% |
| Dutch | 27.4 /100 | #192 | Fair 1.8% |
| German Russians | 27.1 /100 | #193 | Fair 1.8% |
| Uruguayans | 26.2 /100 | #194 | Fair 1.8% |
| Immigrants | Somalia | 25.4 /100 | #195 | Fair 1.8% |
| Sub-Saharan Africans | 25.1 /100 | #196 | Fair 1.8% |
| Chinese | 25.1 /100 | #197 | Fair 1.8% |
| Immigrants | Ghana | 24.6 /100 | #198 | Fair 1.8% |
| Immigrants | South America | 23.3 /100 | #199 | Fair 1.8% |
| Whites/Caucasians | 22.8 /100 | #200 | Fair 1.8% |
| Immigrants | Nigeria | 22.4 /100 | #201 | Fair 1.8% |
| Portuguese | 21.4 /100 | #202 | Fair 1.8% |
Demographics Similar to Luxembourgers by Doctorate Degree
In terms of doctorate degree, the demographic groups most similar to Luxembourgers are Immigrants from Senegal (1.9%, a difference of 0.33%), Immigrants from Syria (1.9%, a difference of 0.58%), Kenyan (1.9%, a difference of 0.60%), Immigrants from Moldova (2.0%, a difference of 0.78%), and Basque (1.9%, a difference of 0.90%).
| Demographics | Rating | Rank | Doctorate Degree |
| Senegalese | 86.7 /100 | #141 | Excellent 2.0% |
| Italians | 86.0 /100 | #142 | Excellent 2.0% |
| Sierra Leoneans | 85.1 /100 | #143 | Excellent 2.0% |
| Immigrants | Moldova | 84.3 /100 | #144 | Excellent 2.0% |
| Kenyans | 83.6 /100 | #145 | Excellent 1.9% |
| Immigrants | Syria | 83.6 /100 | #146 | Excellent 1.9% |
| Immigrants | Senegal | 82.5 /100 | #147 | Excellent 1.9% |
| Luxembourgers | 81.1 /100 | #148 | Excellent 1.9% |
| Basques | 76.9 /100 | #149 | Good 1.9% |
| English | 75.9 /100 | #150 | Good 1.9% |
| Albanians | 74.8 /100 | #151 | Good 1.9% |
| Immigrants | Kenya | 74.3 /100 | #152 | Good 1.9% |
| Immigrants | Oceania | 74.0 /100 | #153 | Good 1.9% |
| Immigrants | Albania | 72.8 /100 | #154 | Good 1.9% |
| Poles | 72.7 /100 | #155 | Good 1.9% |