Immigrants from Bangladesh vs Luxembourger Doctorate Degree
COMPARE
Immigrants from Bangladesh
Luxembourger
Doctorate Degree
Doctorate Degree Comparison
Immigrants from Bangladesh
Luxembourgers
1.8%
DOCTORATE DEGREE
50.0/ 100
METRIC RATING
174th/ 347
METRIC RANK
1.9%
DOCTORATE DEGREE
81.1/ 100
METRIC RATING
148th/ 347
METRIC RANK
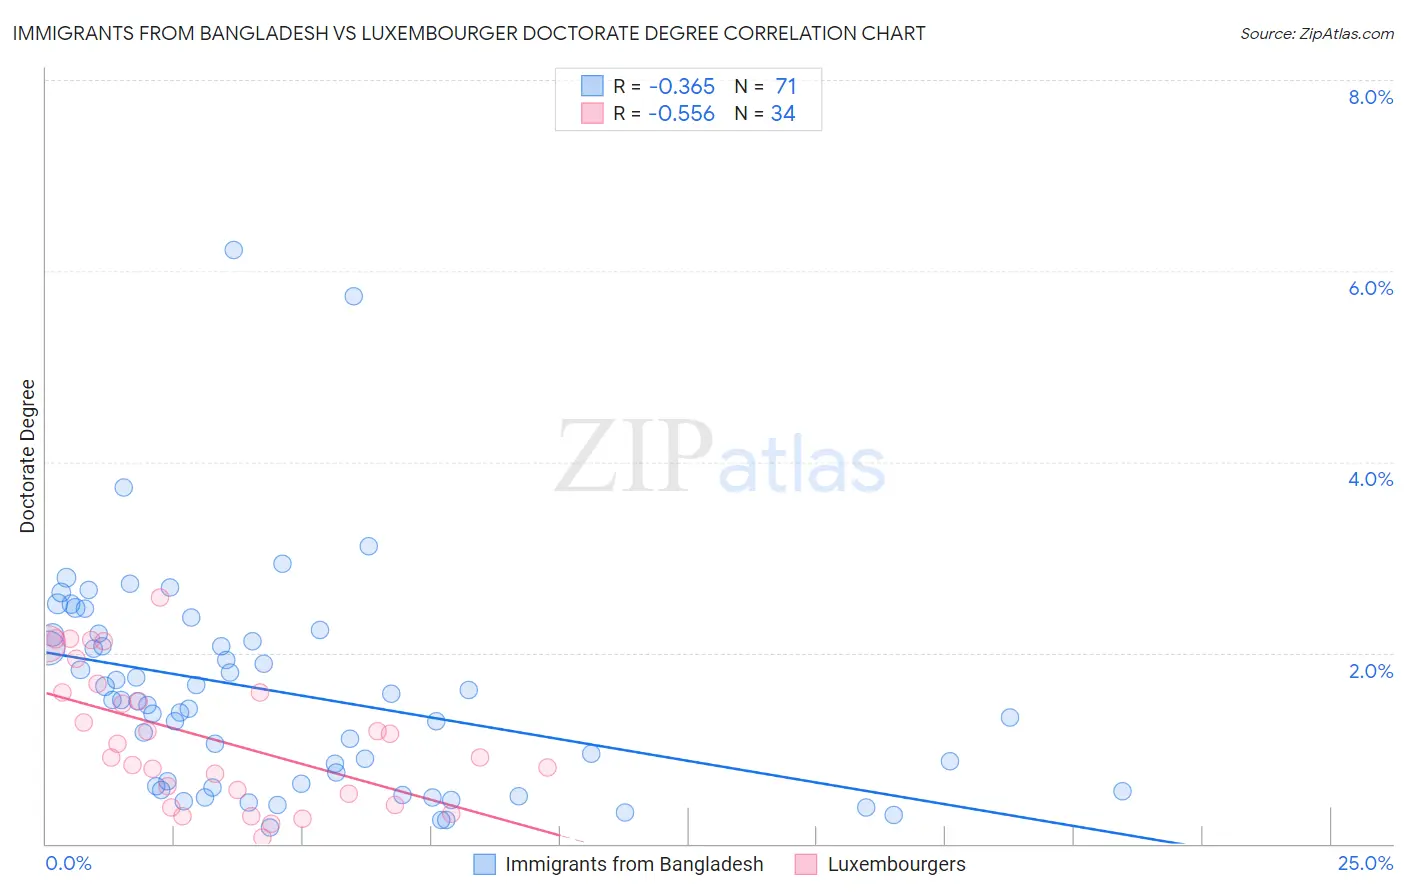
Immigrants from Bangladesh vs Luxembourger Doctorate Degree Correlation Chart
The statistical analysis conducted on geographies consisting of 203,048,073 people shows a mild negative correlation between the proportion of Immigrants from Bangladesh and percentage of population with at least doctorate degree education in the United States with a correlation coefficient (R) of -0.365 and weighted average of 1.8%. Similarly, the statistical analysis conducted on geographies consisting of 144,093,078 people shows a substantial negative correlation between the proportion of Luxembourgers and percentage of population with at least doctorate degree education in the United States with a correlation coefficient (R) of -0.556 and weighted average of 1.9%, a difference of 5.3%.
Doctorate Degree Correlation Summary
| Measurement | Immigrants from Bangladesh | Luxembourger |
| Minimum | 0.17% | 0.063% |
| Maximum | 6.2% | 2.6% |
| Range | 6.0% | 2.5% |
| Mean | 1.6% | 1.1% |
| Median | 1.5% | 0.98% |
| Interquartile 25% (IQ1) | 0.60% | 0.52% |
| Interquartile 75% (IQ3) | 2.2% | 1.6% |
| Interquartile Range (IQR) | 1.6% | 1.1% |
| Standard Deviation (Sample) | 1.1% | 0.70% |
| Standard Deviation (Population) | 1.1% | 0.69% |
Similar Demographics by Doctorate Degree
Demographics Similar to Immigrants from Bangladesh by Doctorate Degree
In terms of doctorate degree, the demographic groups most similar to Immigrants from Bangladesh are Norwegian (1.8%, a difference of 0.0%), Belgian (1.8%, a difference of 0.040%), Immigrants from Thailand (1.8%, a difference of 0.080%), Spanish (1.8%, a difference of 0.10%), and Iraqi (1.8%, a difference of 0.11%).
| Demographics | Rating | Rank | Doctorate Degree |
| Macedonians | 60.9 /100 | #167 | Good 1.9% |
| Sri Lankans | 60.3 /100 | #168 | Good 1.9% |
| Vietnamese | 54.8 /100 | #169 | Average 1.9% |
| Costa Ricans | 53.3 /100 | #170 | Average 1.8% |
| Bermudans | 52.1 /100 | #171 | Average 1.8% |
| Belgians | 50.3 /100 | #172 | Average 1.8% |
| Norwegians | 50.0 /100 | #173 | Average 1.8% |
| Immigrants | Bangladesh | 50.0 /100 | #174 | Average 1.8% |
| Immigrants | Thailand | 49.4 /100 | #175 | Average 1.8% |
| Spanish | 49.3 /100 | #176 | Average 1.8% |
| Iraqis | 49.2 /100 | #177 | Average 1.8% |
| French | 48.8 /100 | #178 | Average 1.8% |
| Ghanaians | 48.3 /100 | #179 | Average 1.8% |
| Scandinavians | 48.0 /100 | #180 | Average 1.8% |
| Immigrants | Immigrants | 46.2 /100 | #181 | Average 1.8% |
Demographics Similar to Luxembourgers by Doctorate Degree
In terms of doctorate degree, the demographic groups most similar to Luxembourgers are Immigrants from Senegal (1.9%, a difference of 0.33%), Immigrants from Syria (1.9%, a difference of 0.58%), Kenyan (1.9%, a difference of 0.60%), Immigrants from Moldova (2.0%, a difference of 0.78%), and Basque (1.9%, a difference of 0.90%).
| Demographics | Rating | Rank | Doctorate Degree |
| Senegalese | 86.7 /100 | #141 | Excellent 2.0% |
| Italians | 86.0 /100 | #142 | Excellent 2.0% |
| Sierra Leoneans | 85.1 /100 | #143 | Excellent 2.0% |
| Immigrants | Moldova | 84.3 /100 | #144 | Excellent 2.0% |
| Kenyans | 83.6 /100 | #145 | Excellent 1.9% |
| Immigrants | Syria | 83.6 /100 | #146 | Excellent 1.9% |
| Immigrants | Senegal | 82.5 /100 | #147 | Excellent 1.9% |
| Luxembourgers | 81.1 /100 | #148 | Excellent 1.9% |
| Basques | 76.9 /100 | #149 | Good 1.9% |
| English | 75.9 /100 | #150 | Good 1.9% |
| Albanians | 74.8 /100 | #151 | Good 1.9% |
| Immigrants | Kenya | 74.3 /100 | #152 | Good 1.9% |
| Immigrants | Oceania | 74.0 /100 | #153 | Good 1.9% |
| Immigrants | Albania | 72.8 /100 | #154 | Good 1.9% |
| Poles | 72.7 /100 | #155 | Good 1.9% |